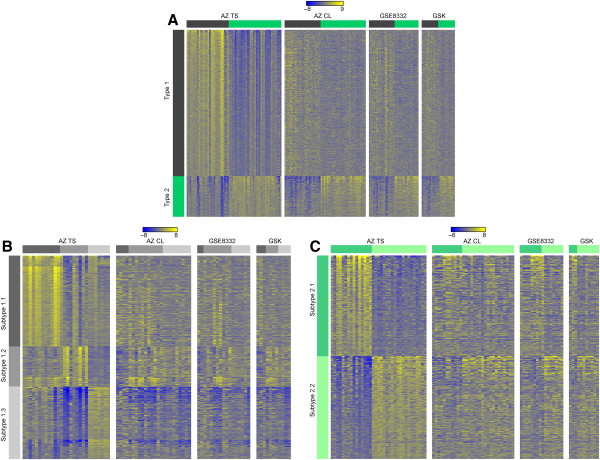
Figure 6.
Expression patterns of CRC subtypes defined by iNMF in the AZTS set and different cell line panels. (A) Cell lines that are matched to Types 1 (black) and 2 (green) show a very similar expression pattern to the tumor samples. Expression in cell lines assigned to (B) the subtypes of Type 1 and (C) subtypes of Type 2 shows less similarity with expression in tumor samples.

