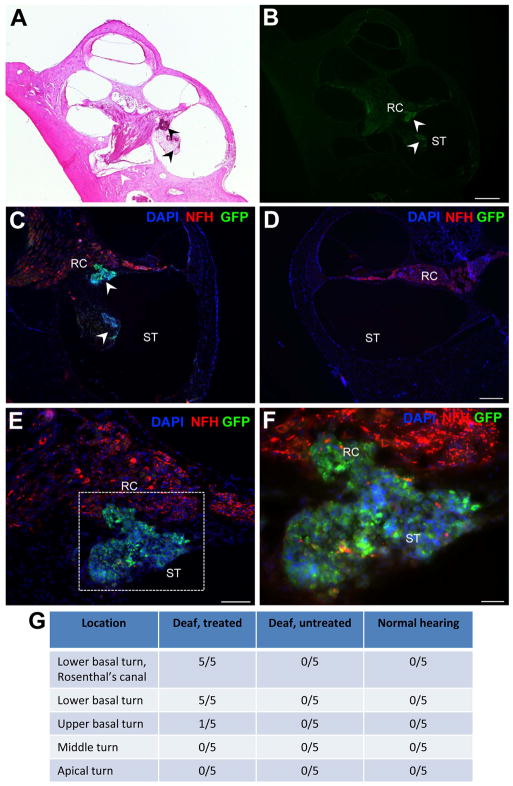
Figure 4. Detection of GFP-positive stem cells in the deaf cochlea.
Low magnification images show implanted stem cells in the lower basal turn of the cochlea (arrowheads in A: H&E stained, and B: GFP-stained). Sequentially higher magnification images of the lower basal turn are shown (C–F) illustrating implanted stem cells (GFP, green, arrowheads C) and endogenous auditory neurons and processes (NFH, red) in the lower basal turn Rosenthal’s canal (RC) and scala tympani (ST). The same region in the deaf untreated cochlea is shown in (D), with no stem cells observed. High magnification image (F) of inset region in (E), illustrating stem cells in RC. Note implanted stem cell sphere is weakly positive for NFH. All images are counterstained with the nuclear marker DAPI (blue; C–F). Table in (G) gives summary of location of stem cells detected in each cochlea examined. Scale bars = 500 μm (B, relative to A); 200 μm (D, relative to C); 100 μm (E), 50 μm (F).

