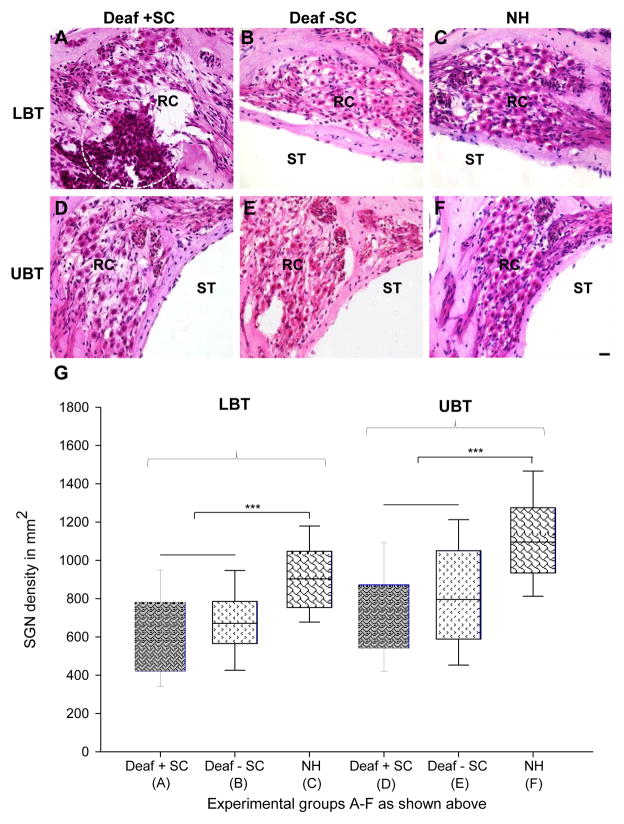
Figure 5. Auditory neuron density measurements and histology.
Representative histological sections (A–F) from the upper and lower basal turns (UBT and LBT, respectively) from each treatment (Deaf + SC; Deaf − SC; NH), illustrating surviving auditoryneurons (ANs) and transplanted stem cells (circled, A). Auditory neuron densities from each treatment group (A–F above) were measured and graphed (G), and no significant difference was detected between deaf treated and deaf untreated animals in either the upper basal or lower basal turns. There were significantly fewer ANs in deaf cochleae (A,B, D,E) in comparison to normal hearing cochleae (P≤0.001; ***). SC: stem cells; NH: normal hearing; ST: scala tympani; RC: Rosenthal’s canal. Scale bar in (F) 20 μm (relative to A–F).

