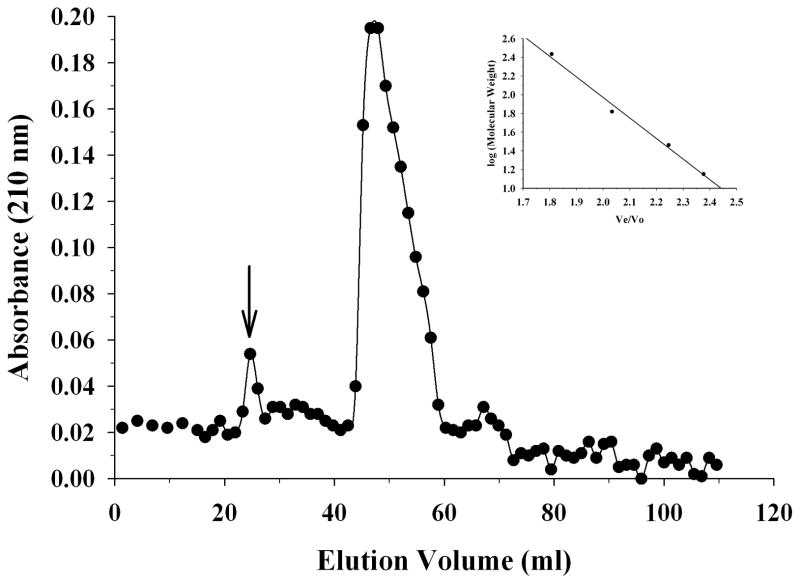
Figure 5.
Size exclusion chromatography of apoE. ApoE (1.5 mg/ml) was loaded on a Sepharose CL-6B size exclusion column operating at a flow rate of 0.5 ml/min in PBS, with 1.2 ml per fraction. The elution profile shows a prominent peak, the molecular mass of which was calculated based on the plot of log molecular weight versus Ve/V0 for the following standards (Inset): α-lactalbumin from bovine milk (14,200 Da), carbonic anhydrase from bovine erythrocytes (29,000 Da), human serum albumin (66,400 Da), urease from Jack Bean (272,000 Da). The arrow corresponds to the peak elution position of blue dextran.

