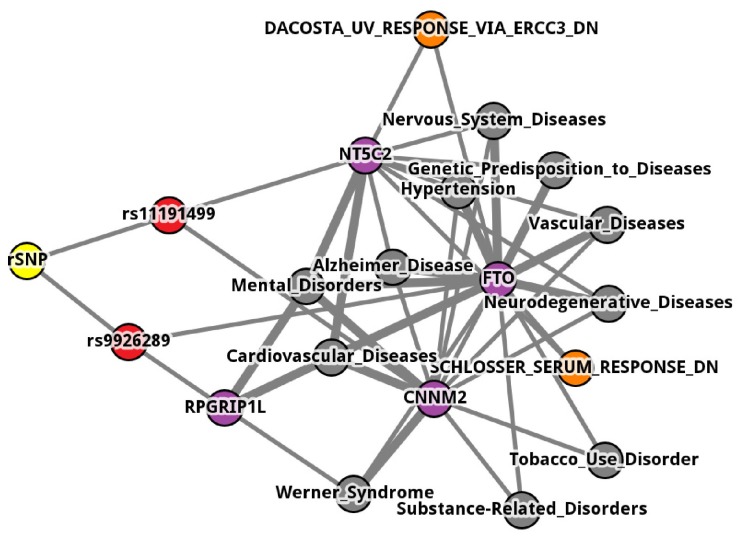
Fig. 2.
A visualization of gene-gene interaction interpretation with biological knowledge. Two red circles denote two single-nucleotide polymorphisms (SNPs) within a two-way interaction, and purple circles denote corresponding genes against two SNPs. Gray circles denote diseases that are known to be related with both of the genes. Yellow and orange circles denote a disrupted transcriptional factor by both of the two SNPs and gene sets including genes from both SNPs, respectively.

