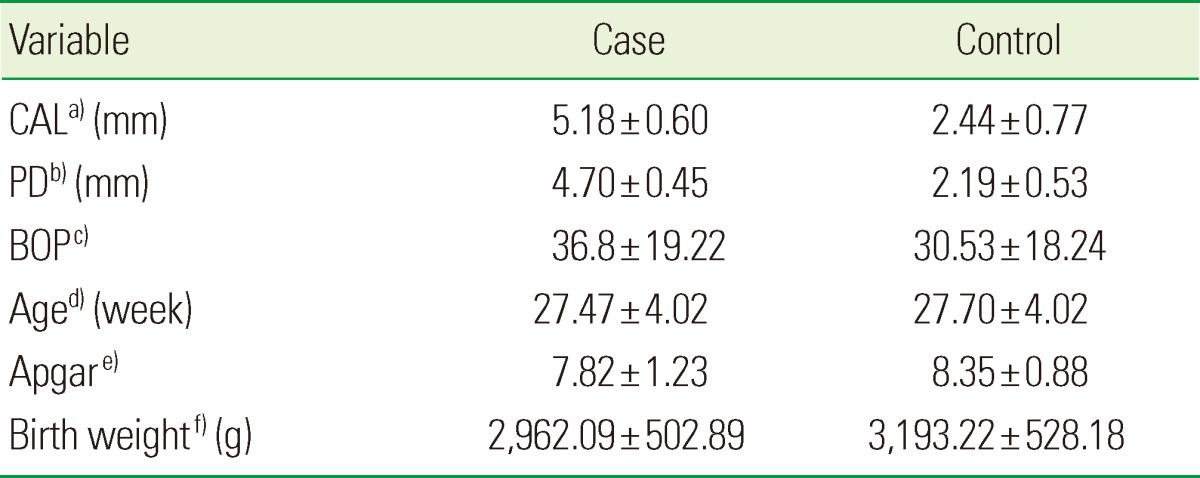
Table 1.
Comparison of differences in the means of CAL, PD and BOP variables, and Apgar score and the weight of the newborn in the test and control groups.

Values are presented as mean±standard deviation.
CAL: clinical attachment loss, PD: probing depth, BOP: bleeding on probing, df: degree of freedom.
a)P=0.000, t=27.10, df=189. b)P=0.001, t=-3.431, df=189. c)P=0.000, t=2.311, df=189. d)P=-0.690, t=-0.399, df=189. e)P=0.022, t=27.10, df=189. f)P=0.002, t=-3.098, df=189.
