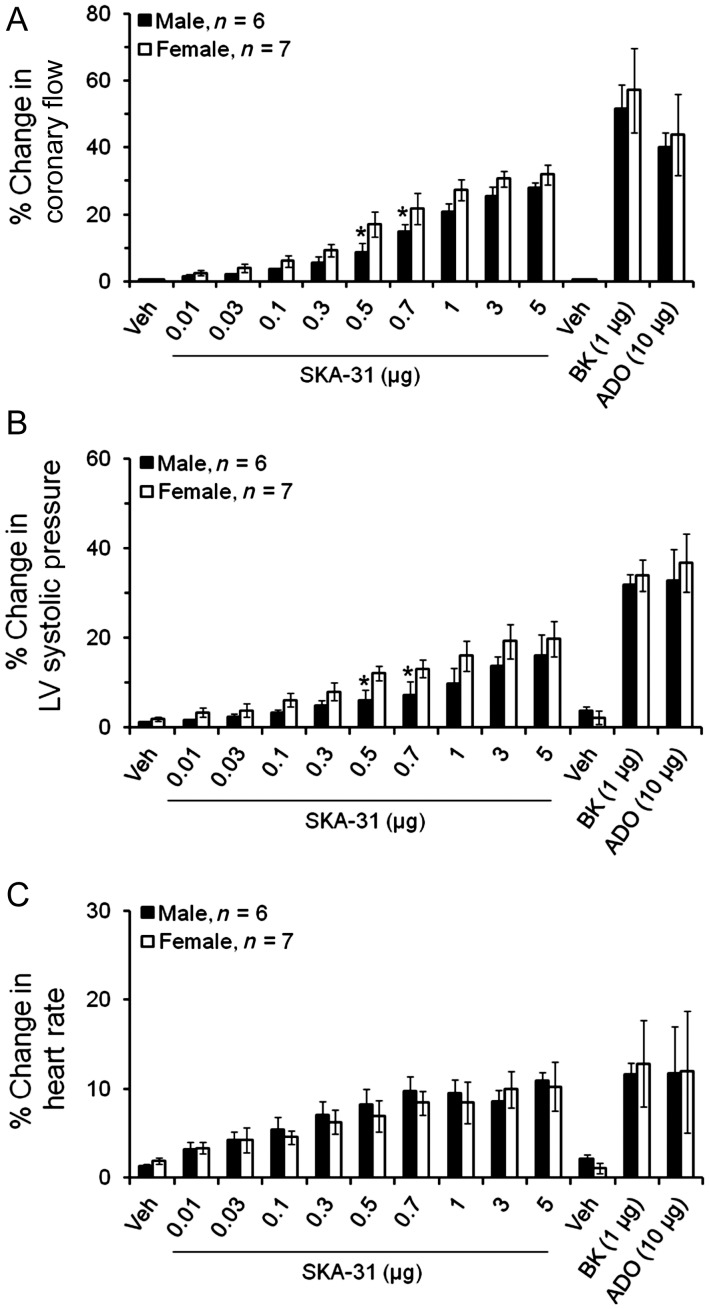
Figure 2.
Quantification of the drug-induced changes in coronary flow, LV systolic pressure, and heart rate following acute bolus administration of SKA-31 (0.01–5 µg), bradykinin (BK, 1 µg), adenosine (ADO, 10 µg), and solvent vehicle (Veh) in male and female hearts. Values are expressed as a percentage increase in a given parameter relative to the baseline value recorded immediately prior to the administration of a given compound. The histogram in (A) quantifies drug-induced changes in total coronary flow. (B and C) Evoked changes in LV systolic pressure and heart rate, respectively, in response to individual drug administrations. Data are presented as mean ± SEM, *P < 0.05 vs. female hearts.

