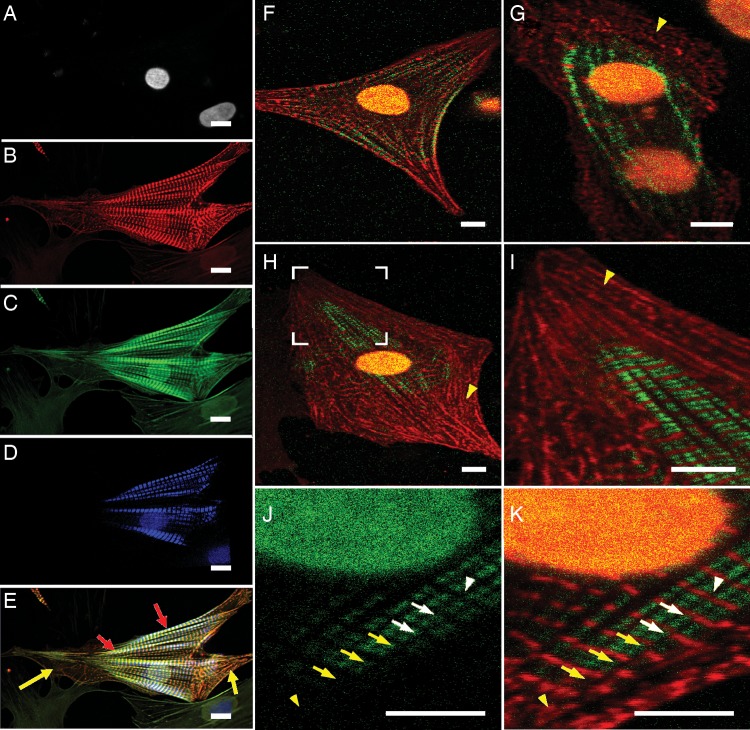
Figure 3.
The myofibril structure of the cardiomyocytes isolated from 3-day-old Sprague–Dawley neonatal rats. (A–C) Confocal images (Nikon Ti microscope) of the nucleus, alpha-actinin, and F-actin fluorescently labelled by DAPI, alpha-actinin antibody, and phalloidin, respectively. (D) The myosin filament image of the same cellular sample as in A–C obtained from the SHG channel of our TPEF–SHG imaging system. (E) Combination of A–D. (F–K) TPEF–SHG images of alpha-actinin (red) and myosin filaments (green). The cells were fixed, and alpha-actinin was fluorescently labelled. The alpha-actinin pattern was acquired in the TPEF channel and the myosin filament pattern was acquired in the SHG channel. (F) A cell in which the striated alpha-actinin pattern (red) is colocalized with the SHG signal pattern (green) in the middle of the myofibrils at the cell edge. (G) A fused cell pair in which the striated alpha-actinin pattern (red) is co-localized with the SHG signal pattern (green) in the centre. (H) A cell in which the striated alpha-actinin pattern (red) is co-localized with the SHG signal pattern both in the cell centre and at the cell edge in the middle of the myofibrils. (I) Magnification of the area surrounded by the white bracket in H. The yellow arrowheads in G–I point to the short-term Z-bodies of premyofibrils. (J and K) Magnified SHG signal pattern (green) and alpha-actinin staining (red) of another cell; K is the SHG single pattern shown in J overlapped with the corresponding alpha-actinin pattern. The white arrowhead indicates the perfectly aligned Z-disks among adjacent mature myofibrils. The white arrows point to the Z-disks in adjacent myofibrils; these were connected to each other, but not perfectly aligned. The yellow arrows point to non-aligned striated alpha-actinin clusters. The yellow arrowhead points to an area with non-striated alpha-actinin clusters (premyofibrils) (scale bar: 10 μm)

