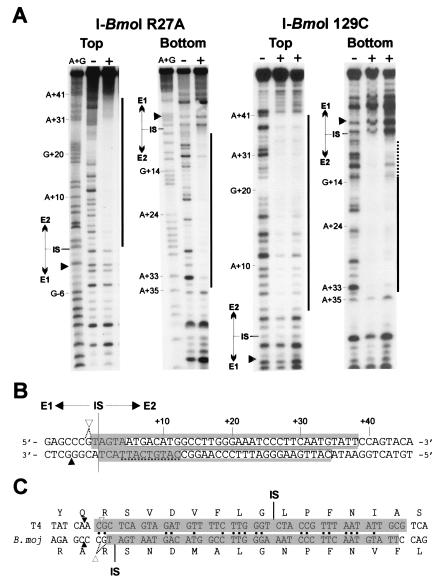
Figure 4.
I-BmoI has an unusually asymmetric footprint with respect to the intron IS. (A) Shown is DNase I protection assay with no protein (−), I-BmoI R27A (18 μM), or I-BmoI 129C (33 and 11 μM) on top or bottom strands of intronless substrate. Black bars indicate region protected by each protein. Weak protection was observed on the bottom strand with I-BmoI 129C, indicated by a dashed line. Black triangles indicate position of I-BmoI cleavage sites. (B) Extent of I-BmoI R27A footprint is indicated by a shaded box and by a white box for I-BmoI 129C. Cleavage sites are labeled as in Fig. 2. (C) I-BmoI and I-TevI protect the same homologous stretch of DNA of their respective intronless substrates. Shaded regions indicate extent of DNase I protection on the top strand of intronless substrates for I-BmoI R27A and I-TevI R27A (10). Identical nt between the two TS genes are indicated by black dots. Intron IS and cleavage sites for I-BmoI and I-TevI are indicated.

