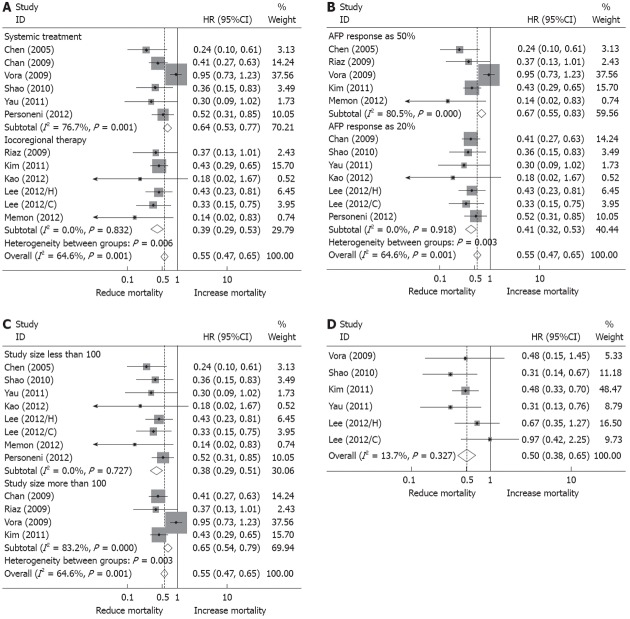
Figure 1.
Forest plots representing hazard ratios of overall survival and progression free survival in hepatocellular carcinoma patients associated with α-fetoprotein response. A: Subgroup analysis according to systemic treatment and locoregional therapy; B: Subgroup analysis according to α-fetoprotein (AFP) response definition of 20% decline of its initial level and 50% decline; C: Subgroup analysis according to study size larger than 100 patients and less than 100 patients; D: Hazard ratios (HRs) of progression free survival in hepatocellular carcinoma patients associated with AFP response.

