Figure 3.
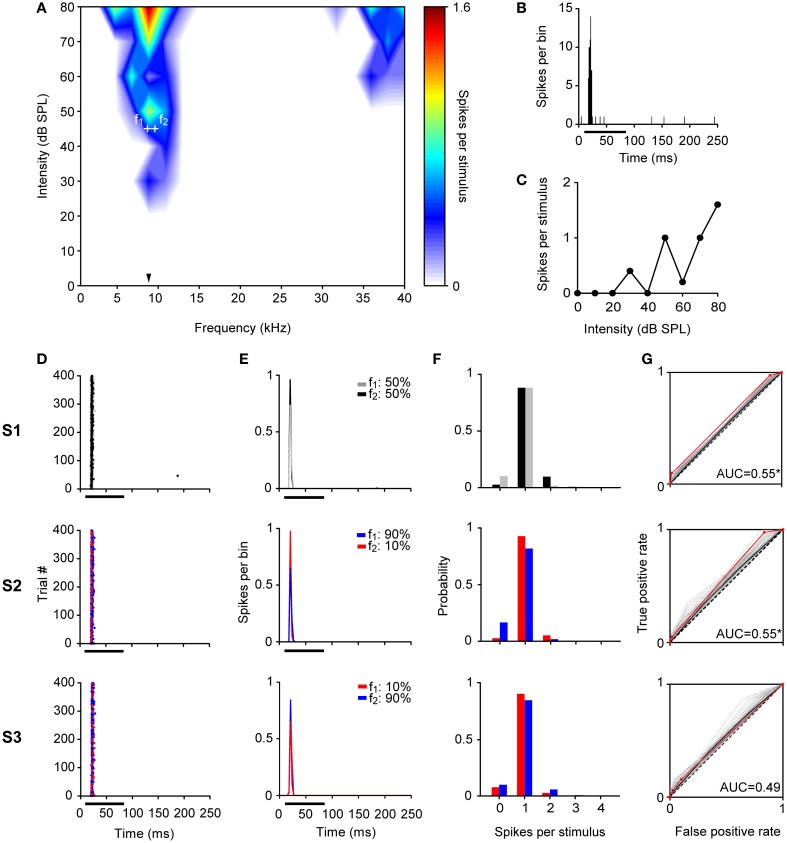
Example of a non-adapting neuron in the IC. (A) Narrow FRA in color code for response magnitude. The tested frequencies (f1: 8.7 kHz, f2: 9.6 kHz, white crosses) were chosen around the BF (8.8 kHz) (arrowhead), at 45 dB SPL. (B) PSTH of the accumulated response to all the frequencies (0.5 – 40 kHz) and intensities (0 – 80 dB SPL) presented (1 ms bins). (C) Rate-level function at BF. (D–G) The responses of the neuron for each pair of stimuli for each of the three sequences (S1, S2, S3) are shown as dot raster plots (D), PSTH (3 ms bins) (E), spike probability distributions (F), and ROC curves (G). In the dot raster each dot represents the occurrence of a spike. The black bar under the PSTH and dot raster plots indicates the duration of the stimulus (75 ms). The probability of each frequency for each sequence is indicated on the upper left of the (E) panels. In the ROC curves (G) the dashed line corresponds to random guessing or no stimulus discrimination (AUC = 0.5), indicating complete overlap of the spike probability distributions. The red line represents the ROC curve calculated using the recorded data, the curves plotted in gray were obtained with the permutation method of the original spike count distributions, and the black line is represents the mean ROC curve of permutations. A total of 10,000 permutations were calculated, but for visual clarity only 100 curves are displayed. For each ROC curve, the area under the ROC curve (AUC) is shown corresponding to the original AUC value minus the mean AUC from permutations, as well as, the significance value for AUC > 0.5 (Permutation test; *p < 0.05). The repetition rate was 4 Hz and the frequency separation was 0.141 octaves. This neuron did not show SSA (CSI = 0.04, Bootstrapping; p > 0.05), displaying a very similar response to f1 and f2 across the three sequences regardless the probability of each tone.

