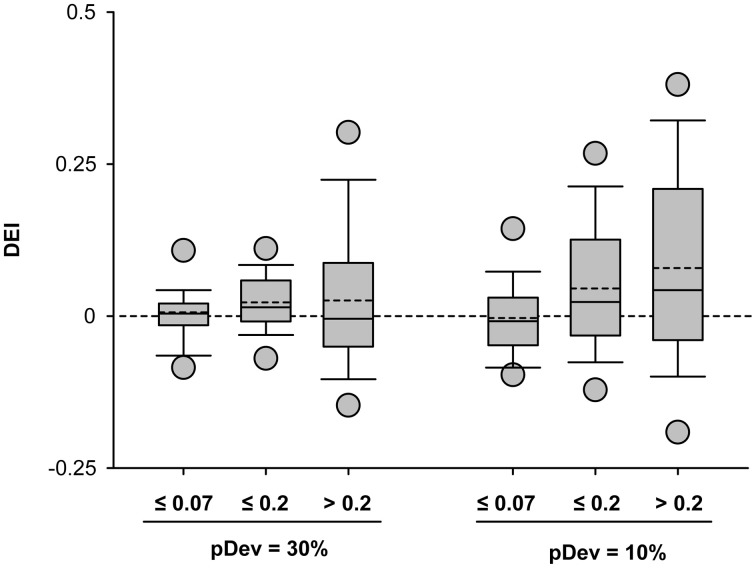
Figure 7.
Stimulus discriminability enhancement of IC neurons across different stimulus conditions. Box plots of the discriminability enhancement under the oddball condition (DEI) showing the mean (dashed line) and the median (solid line) values, as well as, the 5th and 95th outliers. All the mean values were positive (except for the 10%/Δf ≤ 0.07 condition), reflecting a better stimulus discrimination when one of the frequencies is presented as a deviant tone, that is, with low probability of ocurrence (30 or 10%). The DEIs were only affected by the frequency separation [F(2, 489) = 5.72, p < 0.01] (Two-Way ANOVA, deviant probability × frequency separation).

