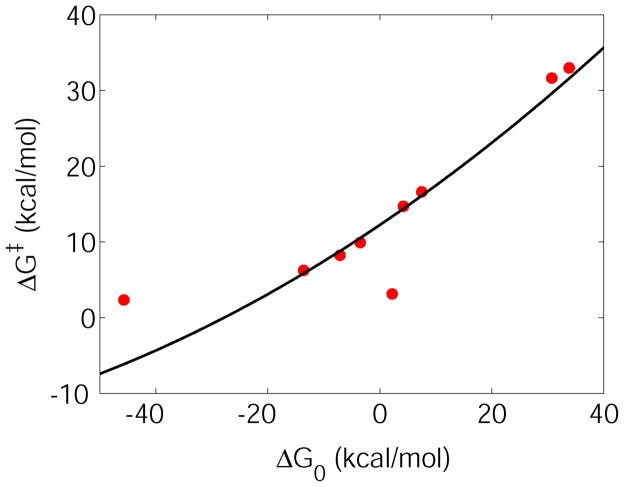
Figure 8.
Adiabatic gas phase energy barriers for the XCH3 + Cl− → X− + CH3Cl SN2 reactions as a function of the reaction energy. Please note that the free energies here are approximated with results from energy minimizations. The results shown are based on Table 1 and Table 2. The black curve corresponds to the parabola obtained from Eq. (25), assuming constant reorganization energy of 116.6 kcal/mol, and assuming negligible coupling in the reactant or product states, and a constant off-diagonal coupling matrix element of 16.9 kcal/mol.

