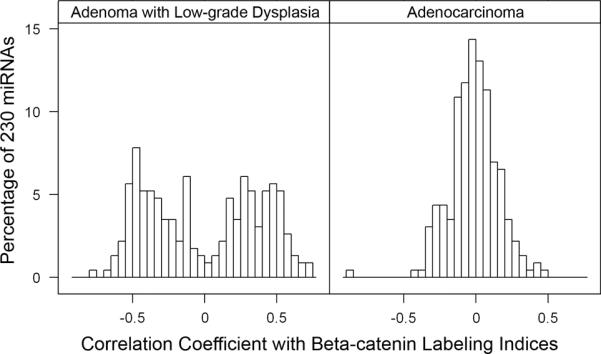
Figure 5.

Histograms of Spearman rank correlation coefficients between levels of miRNA expression and nuclear β-catenin labeling indices. The X-axis has the correlation coefficient values, and the Y-axis indicates the percentage of the 230 miRNAs that were differentially expressed in the NM-A-AC sequence with the corresponding correlation coefficient values. A biomodal distribution is evident in adenomas with low-grade dysplasia (ALG) indicating that numerous miRNAs have positive or inverse correlation of their expression with β-catenin expression. In contrast, carcinomas (CA) have a normal distribution with only small numbers of miRNAs with expression correlated with β-catenin expression. The findings indicate the importance of miRNA alterations at the earliest step in tumorigenesis.
