
Figure 1.
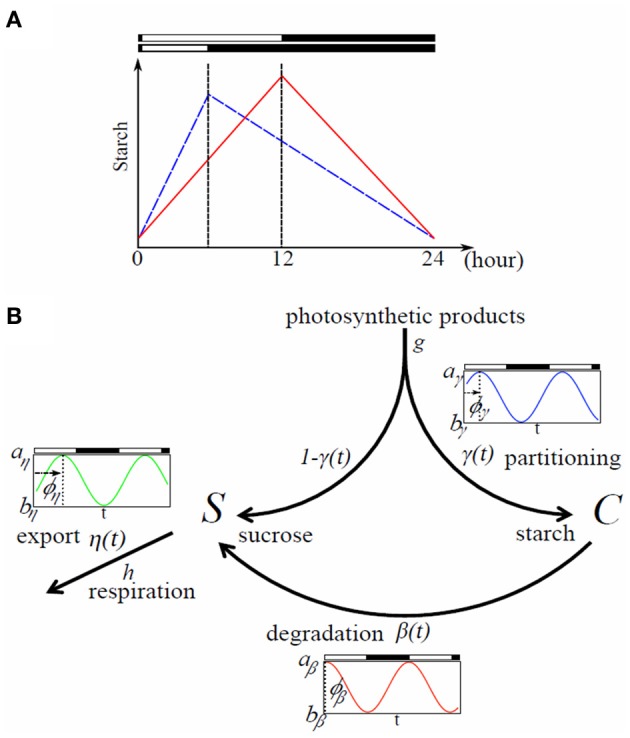
Typical starch diurnal pattern in a long (LD) and short day (SD) (A) and flow chart of the model (B). (A) Scheme of starch idealized diurnal pattern in LD (12 h light/12 h dark; red) and SD (6 h light/18 h dark; blue) in plant leaves. The rate of starch synthesis is larger in short days whereas the degradation rate is smaller. This allows the leaves avoiding running out of starch, and therefore sucrose during night. (B) Flow chart of the model. Rates γ(t), β(t), and η(t) can be circadian regulated with a phase shift ϕi (i ∈ {γ, β, η}); ai and bi represent the maximum and minimum values of oscillation of the rate i, respectively.