Figure A1.

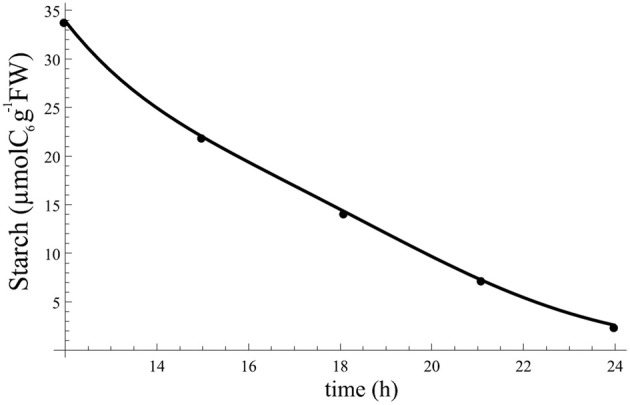
Starch profile at night resulting from fitting Equation (A1) to data and using β(t). Points indicate the data to which Equation (A1) was fitted.

Starch profile at night resulting from fitting Equation (A1) to data and using β(t). Points indicate the data to which Equation (A1) was fitted.