
Figure A5.
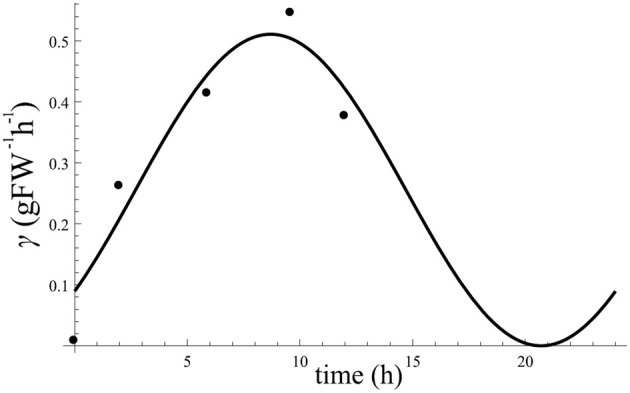
Estimated point values for γ(t) at each sample data from Figure 2A using constant . The curve is the result of fitting a cosine to the estimation points of γ(t). By fitting a cosine function to the obtained estimations for γ(t) we obtain aγ = 0.51, bγ = 0, and ϕγ = 7.8.