
Figure A6.
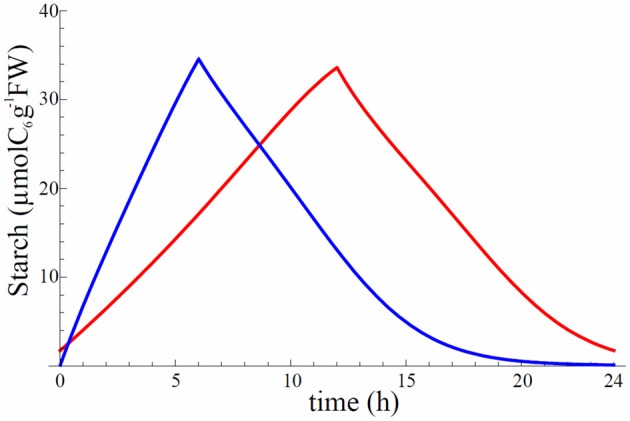
Starch profile for model 8 after convergence of gradient descent using homeostasis cost function. Red is for 12 h/12 h and blue is for 6 h/18 h L/D cycle.
Official websites use .gov
A
.gov website belongs to an official
government organization in the United States.
Secure .gov websites use HTTPS
A lock (
) or https:// means you've safely
connected to the .gov website. Share sensitive
information only on official, secure websites.
Starch profile for model 8 after convergence of gradient descent using homeostasis cost function. Red is for 12 h/12 h and blue is for 6 h/18 h L/D cycle.