Figure 6.
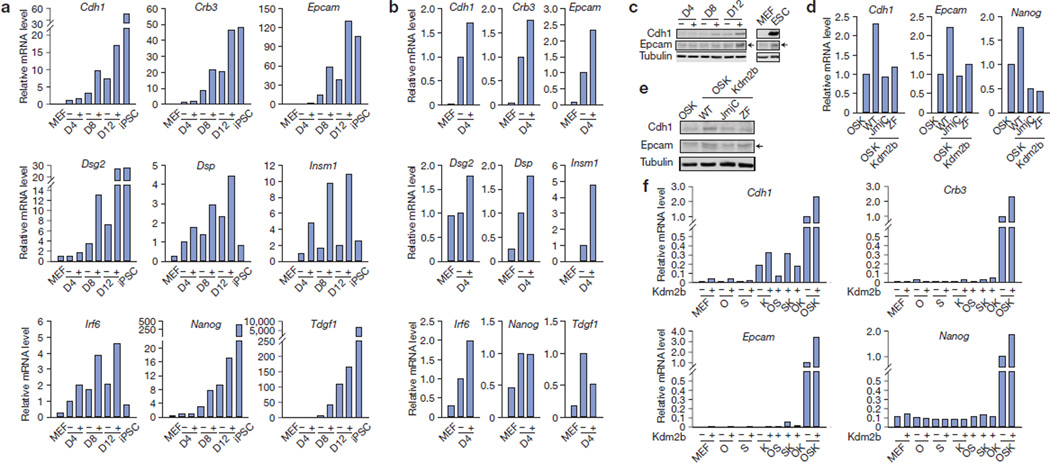
Kdm2b activates early responsive genes in reprogramming. (a) RT–qPCR analysis verifying genes upregulated at different time points in Kdm2b-facilitated reprogramming. RNA samples were extracted from MEFs, iPSCs and cells at day 4 (D4), 8 (D8) and 12 (D12) during reprogramming by OSK (−) and OSK plus Kdm2b (+). The qPCR results were normalized to Gapdh and compared with the samples in the absence of Kdm2b (−) at D4. (b) Epithelial gene expression amplified by Kdm2b at the earliest time point. Expression data from a were rescaled to manifest the enhancement by introducing Kdm2b into the OSK cocktail (−) at day 4 (D4). The expression of OSK reprogramming (+) is set to 1. (c) Western blot analysis demonstrates upregulation of Cdh1 and Epcam by Kdm2b. Protein extracts from the reprogramming cell samples in a, as well as MEFs and ESCs, were used. Tubulin serves as a loading control. (d) RT–qPCR analysis demonstrates that Kdm2b-enhanced activation of Cdh1, Epcam and Nanog depends on its JmjC and ZF domains. The analysis is performed at day 12 of reprogramming with cells reprogrammed by OSK, or OSK plus wild-type Kdm2b (WT), its JmjC or ZF mutants. All of the qPCR results were normalized to Gapdh and compared with the OSK reprogramming. (e) Western blot analysis of Cdh1, Epcam and tubulin with protein extract from the reprogramming cell samples in c. (f) Kdm2b cooperates with Oct4, Sox2 and/or Klf4 in transcription activation. RT–qPCR analysis of the expression of Cdh1, Crb3, Epcam and Nanog in MEFs transduced with individual factors of Kdm2b, Oct4 (O), Sox2 (S) and Klf4 (K), as well as different factor combinations. RNA samples were collected at post-transduction day 12. The qPCR results were first normalized to Gapdh and then compared with the sample transduced by OSK. Data in a, b, d and f represent the mean of two independent experiments. Full scans of blots are shown in Supplementary Fig. S6c.

