
Figure 3.
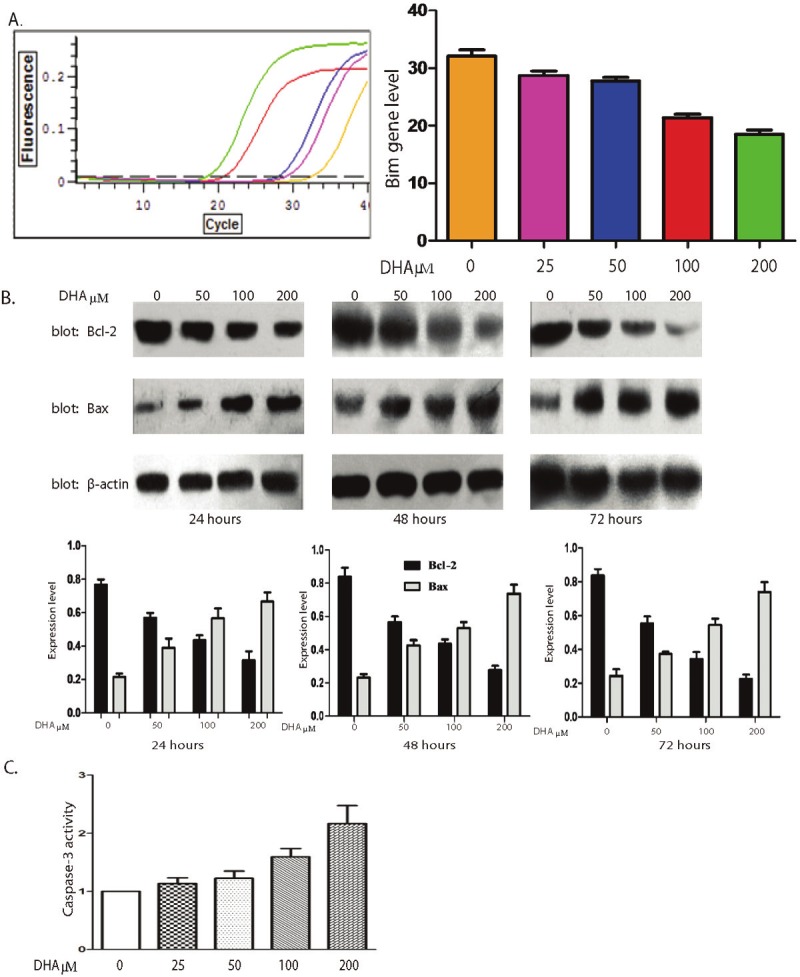
DHA activate the mitochondrial apoptotic pathway on Bel-7402 cells. A. After treatment with 0-200μM DHA for 48h, the real-time PCR shown that the expressions level of Bim gene was increased (left panel). The quantification of the expression level is shown in right panel, data represent triplicate experiments ± SD. B. The Bel-7402 cells were treated with DHA in different concentrations (0-200μM) for 48h. Protein levels of Bcl-2 and Bax were monitored by Western blot. The protein level of β-actin was used as loading control (upper panel). The quantification of the expression level is shown in lower panel, data represent triplicate experiments ± SD. C. The Bel-7402 cells were treated with DHA in different concentrations (0-200μM) for 48h. The activity of Caspase-3 was detected by measuring absorbance at 405 nm. Result was quantified, data represent triplicate experiments ± SD.