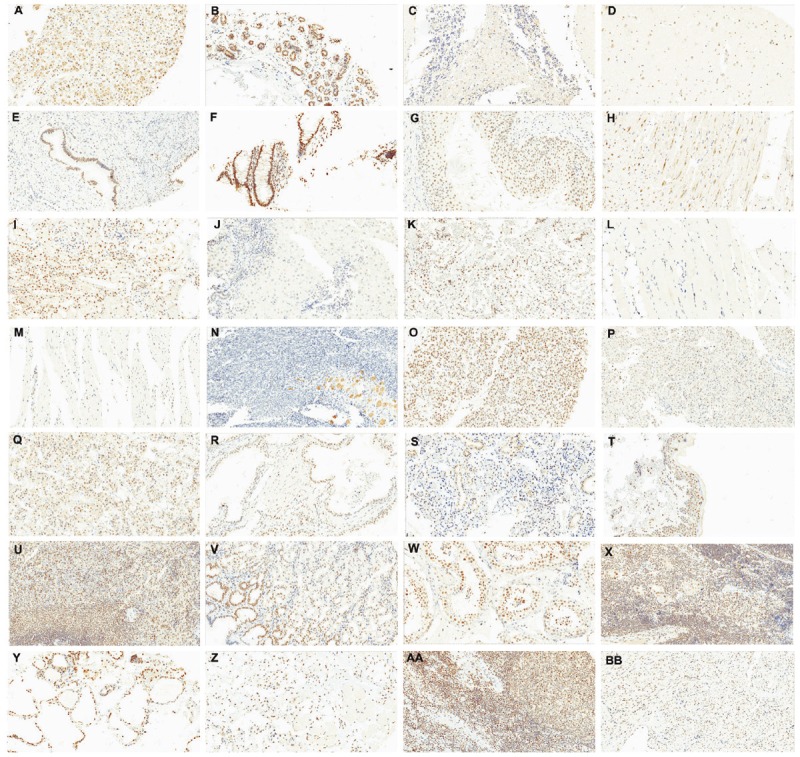
Figure 3.

Expression of XPG protein in human normal tissues. A: adrenal gland; B: breast; C: cerebellum; D: cerebrum; E: cervix; F: colon; G: esophagus; H: heart; I: kidney; J: liver; K: lung; L: skeletal muscle; M: smooth muscle; N: ovary; O: pancreas; P: parathyroid; Q: pituitary; R: prostate; S: salivary gland; T: skin; U: spleen; V: stomach; W: testis; X: thymus; Y: thyroid; Z: tongue; AA: tonsil; BB: uterus. Selected photomicrographs were performed at 20X. Staining was performed on a tissue microarray.
