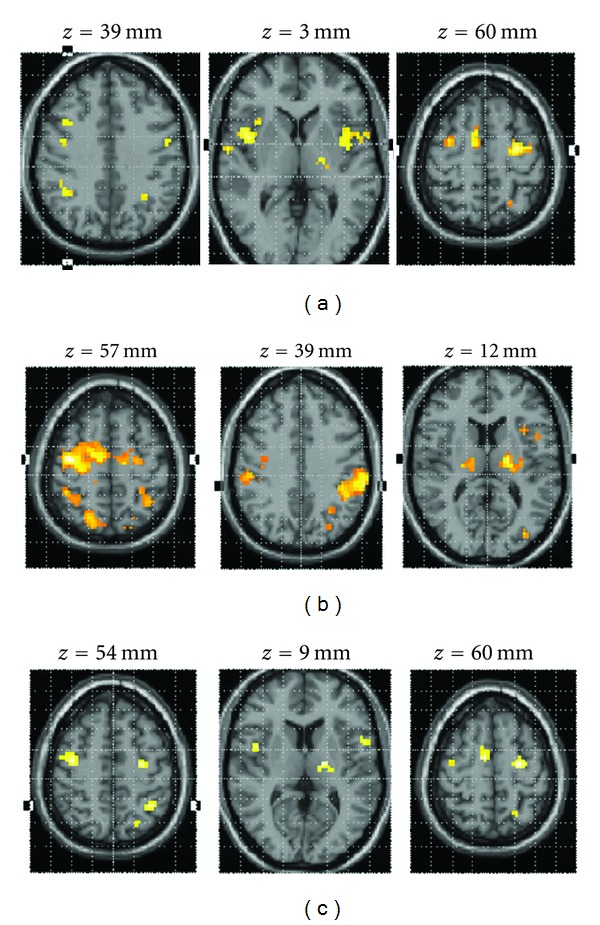
Figure 2.

Statistical parametric maps of brain activity of different comparisons: “Imagery of the affected hand” > rest; “Pinching with the affected hand” > Rest; common areas of activations for motor imagery and motor execution. (a) Statistical parametric maps of brain activity “Imagery of the affected hand” > rest. Activations detected during imagined movement of the affected hand. (b) Statistical parametric map for the contrast pinching affected > rest. Activations detected in primary motor and somatosensory areas, as well as premotor areas and parietal lobules. (c) Common areas of activation for motor imagery and actual execution of the force tracking task with the impaired hand. Activations detected in a widely distributed frontoparietal network and subcortical structures. The SPMs threshold set at P < 0.005 uncorrected with a cluster size k ≥ 15 voxels, and superimposed on an axial slice of the MNI single-subject T1 template.
