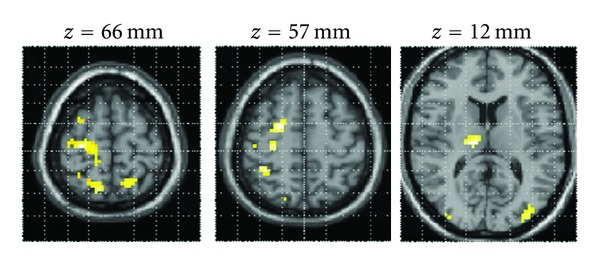
Figure 3.

Statistical parametric map for the contrast “Pinching with the affected hand” > “Imagery of the affected hand”. The figure displays the expected activation of movement-related areas, such as primary motor and somatosensory cortex, premotor cortices, inferior, and superior parietal lobule. The map was thresholded at P < 0.005 uncorrected with cluster size k ≥ 15 voxels, and overlaid onto the MNI single-subject T1 template. There were no activation for the opposite contrast “Imagery of the affected hand” > “Pinching with the affected hand” at the threshold of P < 0.005 uncorrected (k ≥ 15 voxels).
