
Figure 1.
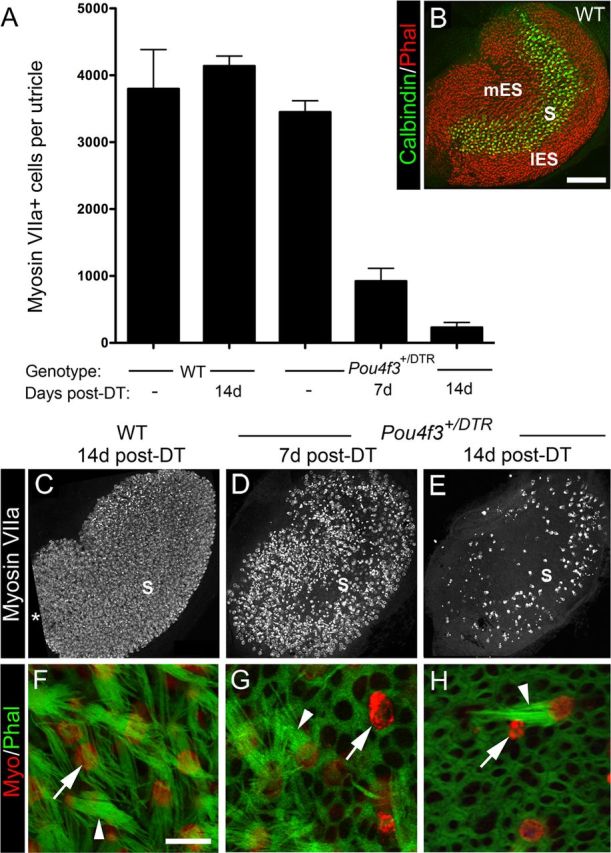
Pou4f3+/DTR mice show significant loss of hair cells after in vivo DT treatment. Hair cell loss was assessed qualitatively and quantitatively in adult mice that received either two DT injections or no DT treatment. A, Graph shows mean numbers of myosin VIIa+ cells (hair cells) per utricle (±SD) for the following groups with different genotypes and DT treatments: untreated (−) wild-type (WT) mice, treated WT mice at 14 days post-DT, untreated (−) Pou4f3+/DTR mice, and Pou4f3+/DTR mice at 7 and 14 days (d) post-DT. Sample numbers for counts are provided in Table 1. B, Confocal brightest point projection image of a whole-mount wild-type (WT) utricle labeled for calbindin D28k (green) and phalloidin (red), illustrating the location of the medial extrastriola (mES), striola (S), and lateral extrastriola (lES). C–E, Confocal brightest point projections of whole-mount utricles labeled for myosin VIIa from WT mice at 14 days post-DT (C) and Pou4f3+/DTR mice at 7 days post-DT (D) and 14 days post-DT (E). S indicates the approximate position of the striola. All utricles are oriented in the same manner. Asterisk in C indicates region where sensory epithelium was not imaged. F–H, High-magnification confocal slices near the lumenal surface of the sensory epithelium showing myosin VIIa (red) and phalloidin labeling (green) from WT mice at 14 days post-DT (F) and from Pou4f3+/DTR mice at 7 days (G) and 14 days post-DT (H). Arrowheads in F–H point to long bundles. The arrow in F points to the top of a normal-appearing hair cell. Arrows in G and H point to remaining damaged hair cells or hair cell debris. Scale bars: (in B) B–E, 100 μm; (in F) F–H, 6 μm.