Figure 10.

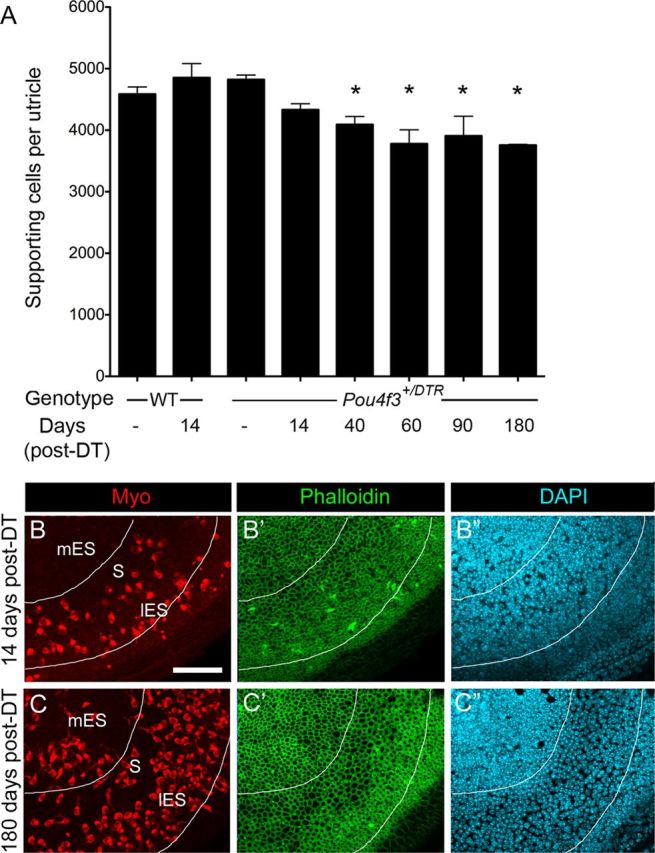
Supporting cell densities decline as hair cells are replaced. A, Graph of average number of supporting cells per utricle (±SD) in uninjected (−) WT mice, WT mice at 14 days post-DT, uninjected (−) Pou4f3+/DTR mice, and Pou4f3+/DTR mice at several times post-DT. Sample numbers for counts are provided in Table 1. Asterisks denote values that are significantly different from those of uninjected wild-type mice (ANOVA, Fisher's PLSD; p < .05). B–C′, Confocal slices of Pou4f3+/DTR mouse utricles at 14 days post-DT (B–B″) and at 180 days post-DT (C–C″) labeled for myosin VIIa (Myo), phalloidin, and DAPI. The same field is shown in B–B″ and in C–C″ with B, B′, C, and C′ focused on the hair cell layer and B″ and C″ focused on the supporting cell layer of each field. Note the apparent expansion of supporting cell surfaces (C′) and decrease in supporting cell nuclear density (C″) in the presumed striola/lateral extrastriola at 180 days relative to 14 days. The lines surround the region that shows supporting cell thinning at 180 days post-DT. mES, Medial extrastriola; S, striola; lES, lateral extrastriola. Scale bar (in B) B–C″, 50 μm.
