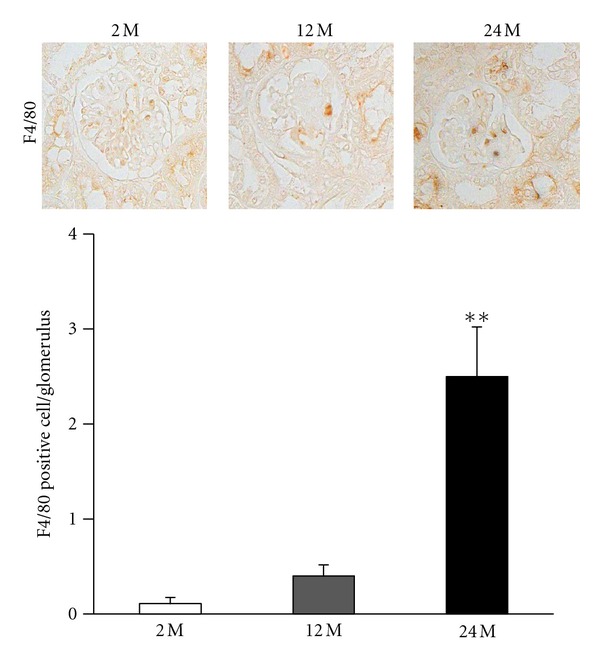
Figure 3.

Immunohistochemistry for F4/80. Result of staining for F4/80-positive cells and quantitative analyses in the 2 M, 12 M, and 24 M groups ((a), original magnification 400×). There was a marked increase in the 24 M group compared with other groups (0.11 ± 0.06% versus 0.4 ± 0.11%, 2.5 ± 0.52%; **P < 0.01 versus 2 M). Values are shown as mean ± SE.
