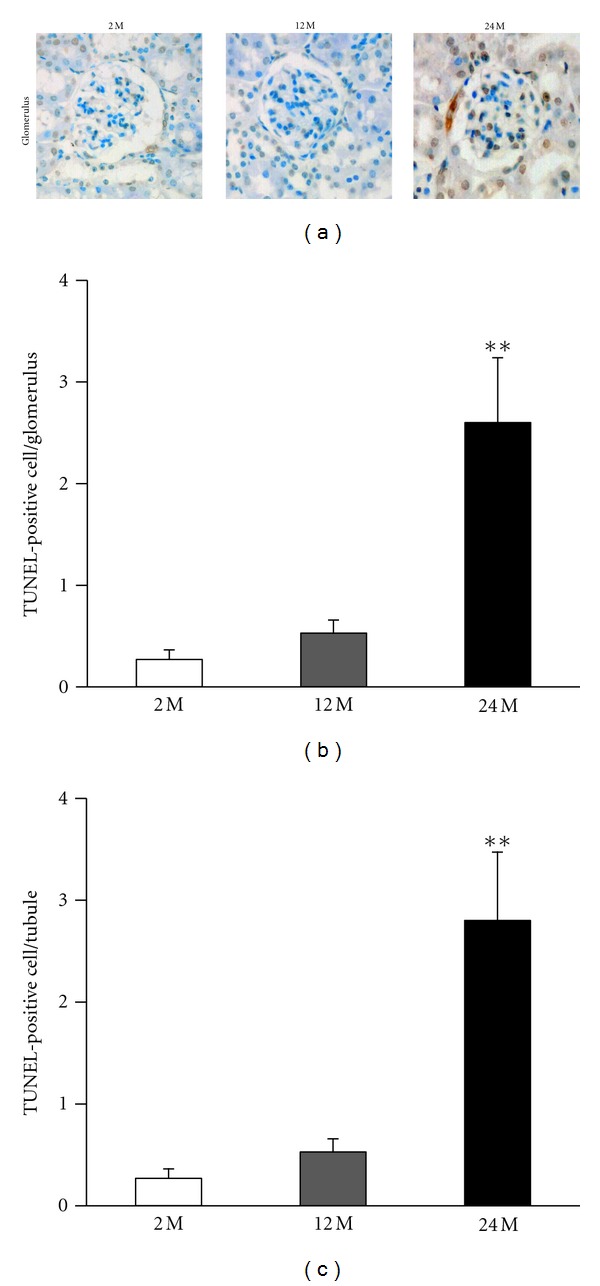
Figure 4.

Increase in apoptotic cells in the glomerulus and tubules of the kidneys from the 24 M group. Representative pictures of TUNEL-positive mesangial cells ((a) original magnification 400×) in the glomerulus and cortical tubular areas for all the study groups. Quantitative analyses of the results are shown ((b) 0.27 ± 0.09% versus 0.53 ± 0.12%, 2.6 ± 0.63%; (c) 0.27 ± 0.09% versus 0.53 ± 0.12%, 2.8 ± 0.67%; **P < 0.01 versus 2 M). Values are shown as mean ± SE.
