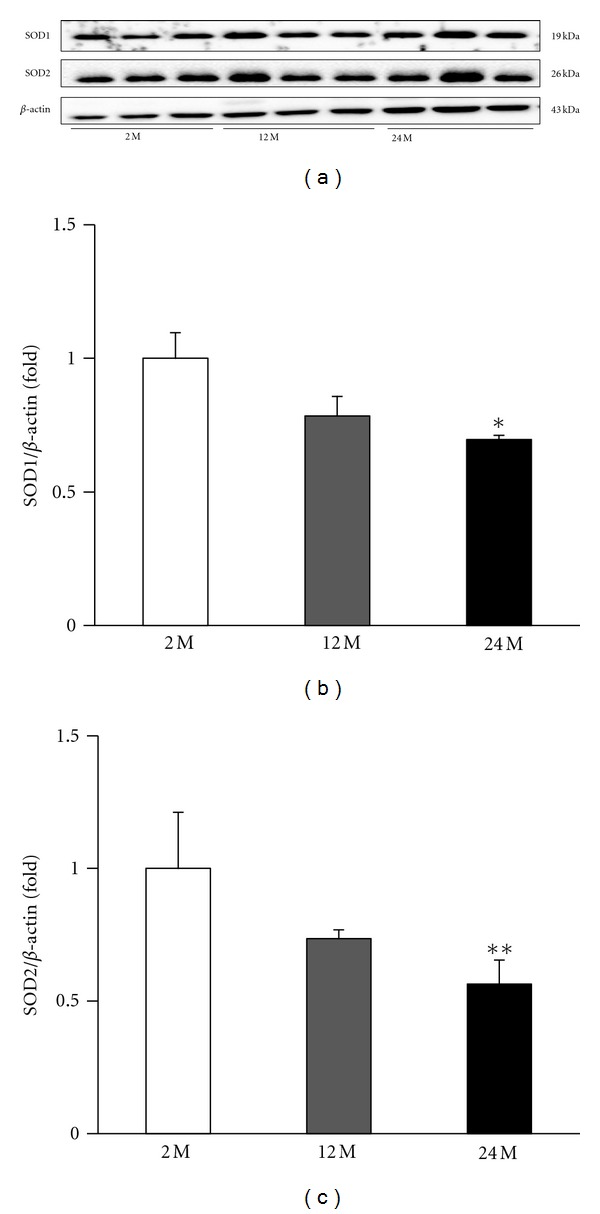
Figure 6.

Representative Western blots of SOD1 and SOD2. Representative blots from the kidney are shown (a). The expression of SOD1 and SOD2 were decreased in the 24 M group compared with 2 M group and lower than 12 M group. Quantitative analyses of the results are shown (b, c). *P < 0.05 versus 2 M, **P < 0.01 versus 2 M.
