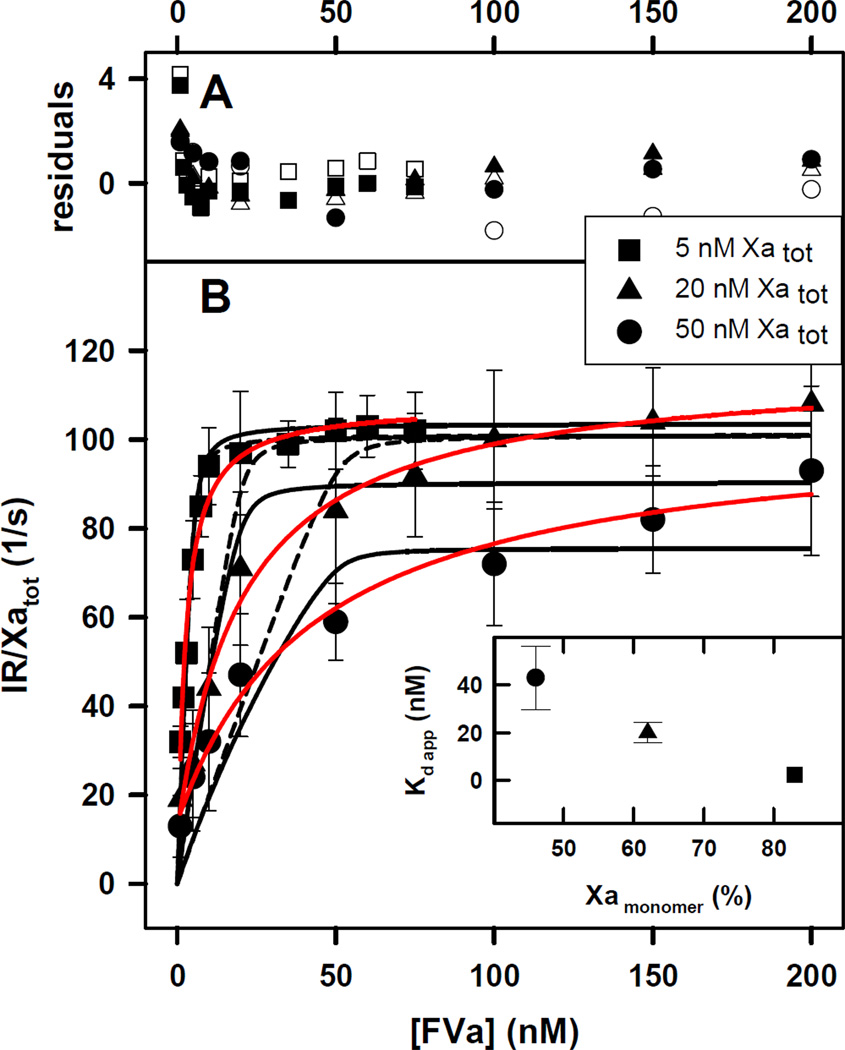
Figure 1. Initial Rate of Prothrombin Activation by FXa-FVa at increasing Concentrations of FVa under Conditions Favoring Dimers.

The FXa-FVa interaction was monitored as an increase in the ability of FXa at 5 (squares), 20 (triangles) and 50 (circles) nM concentrations to activate 1 µM prothrombin while titrating with FVa in the presence of 400 µM C6PS at 5 mM Ca2+. These conditions favor formation of both the FXa dimer and the FXa-FVa complex.
A) the deviation of experimental data from a value predicted by Model 1 (open symbols) and Model 5a (closed symbols) relative to the average standard deviation (Rexp – Rfit)/σmean.
B) The black curves drawn through the symbols indicate the global fit of the data to a simple competition model as described in the Supplement (dashed black line) or to the (XaVa)2 model (Model 5a in Supplement; solid black line. Both models assume that the FXa dimer and XaVa dimer are inactive. Solid red lines represent a fit with hyperbola. Inset: The apparent Kds of FXa-FVa dissociation were 2.2 ±0.6, 20±4.2, and 43 ± 13.3 nM for 5, 20 and 50 nM FXa, respectively. The inset shows a plot of apparent Kd versus % of monomer of FXa obtained using Equation 2 in Methods.
