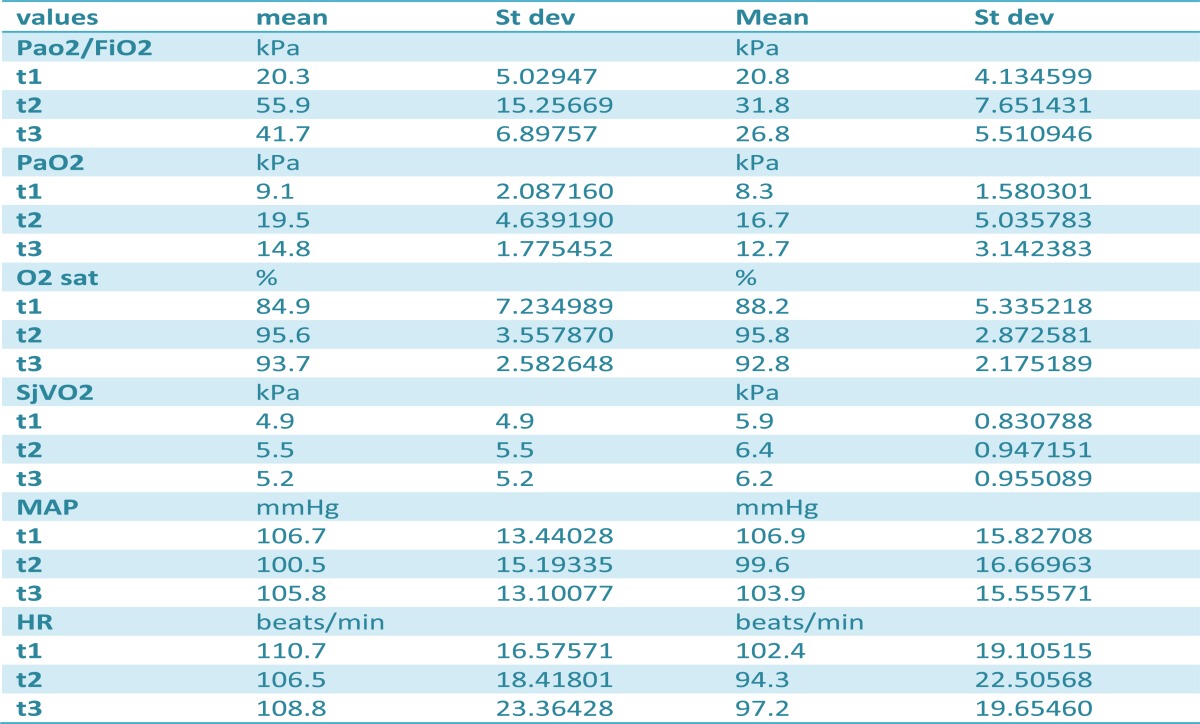
Table 1.
Mean minimum,and maximum values and standard deviation for gas analyses in three time points. t1 before recruitment maneuver t2 five minutes after the recruitment maneuver, t3 one hour after the recruitment maneuver
 |
Mean minimum,and maximum values and standard deviation for gas analyses in three time points. t1 before recruitment maneuver t2 five minutes after the recruitment maneuver, t3 one hour after the recruitment maneuver
 |