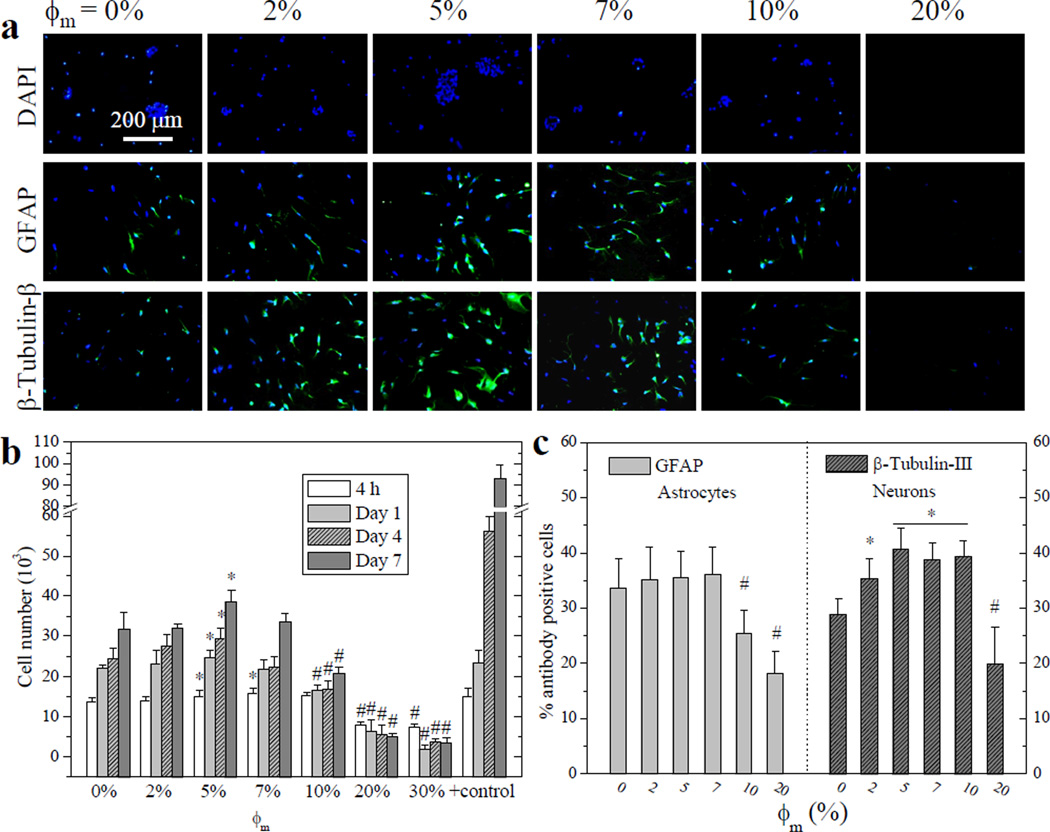
Figure 6.

E14 mouse NPC attachment, proliferation, and differentiated lineages on crosslinked mPEGA/PCLDA disks. (a) Fluorescent images of neurospheres stained using DAPI (blue, top row), differentiated astrocytes stained using anti-GFAP (green, middle row), and neurons stained using anti-β-tubulin-III (green, bottom row) at day 7 post-seeding. Scale bar of 200 µm is applicable to all. (b) NPC proliferation at days 1, 4, and 7, compared with TCPS as positive control. (c) Quantification of percentage of differentiated astrocytes and neurons at day 7. *: significantly higher (p < 0.05); #: significantly lower (p < 0.05) than the corresponding data on crosslinked PCLDA disks.
