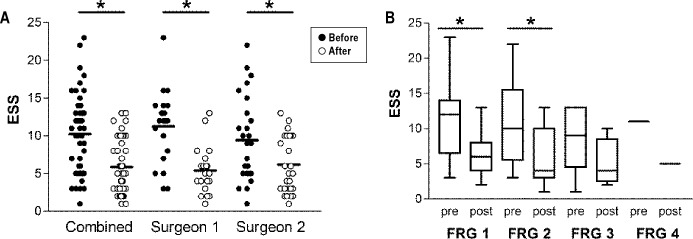
Figure 2. Comparison of preoperative and postoperative Epworth Sleepiness Scale (ESS).
Significant improvements in ESS were observed following surgery. (A) Dot plots representing individual patient ESS result before and after surgery. Data presented for each surgeon and for both surgeons together (combined). (B) Box plot representing median, interquartile range, minimum, and maximum of ESS measurements for the combined data set, with patients tonsil size and palate (relative to tongue) position categorized according to the Friedman (FRG) stage. *p < 0.05 related-samples Wilcoxon signed ranks test. N = 21 Surgeon 1, N = 27 Surgeon 2, N = 48 combined. N = 17, 23, 7, 1 for FRG class 1, 2, 3, 4, respectively.

