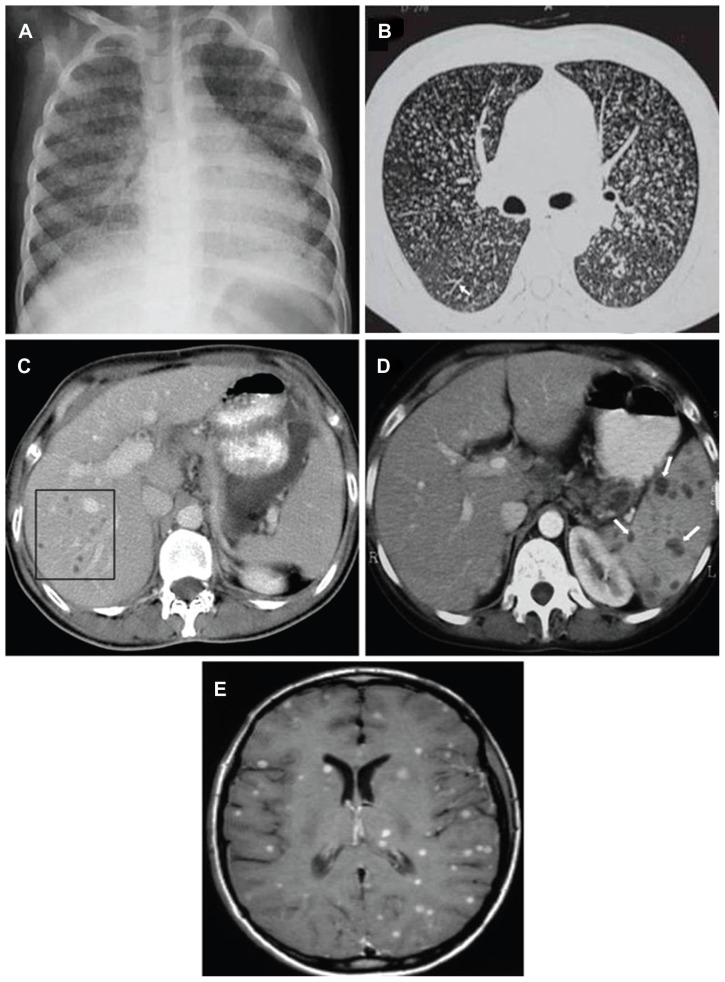
Figure 3.

(A) Chest radiograph (posteroanterior view) showing classical miliary pattern. (B) High-resolution computed tomography image (1.0 mm section thickness) shows uniform-sized small nodules randomly distributed throughout both lungs. Note the classical “tree-in-bud” appearance (white arrow). (C) Contrast-enhanced computed tomography of the abdomen, showing focal miliary lesions in the liver (square) and (D) spleen (white arrows). (E) Miliary central nervous system tuberculosis.
Note: Axial contrast-enhanced T1-weighted magnetic resonance image shows multiple small foci within both cerebral hemispheres.
