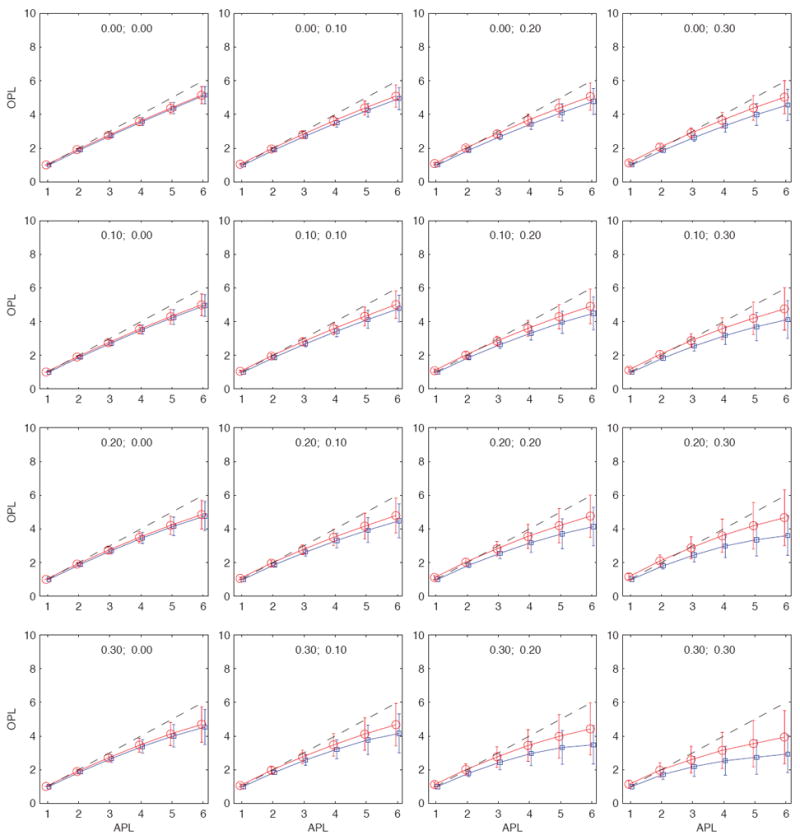
FIG. 3.

(Color online) Observed path lengths (OPL) as a function of the actual path lengths (APL) in a medium-size community of N ≈ 2, 000 nodes. Each panel corresponds to a different fraction of unobserved nodes and unobserved ties as indicated in each panel by the (fn, fe) pair. The blue curves correspond to the average unsampled path lengths ℓu and the red curves to the average sampled path lengths ℓs. The extent of fluctuations is indicated with the error bars, which are given as ℓu (ℓ)±σu (ℓ) for unsampled paths and ℓs (ℓ)± σs (ℓ) for sampled paths. The diagonal dashed black lines corresponds to the identity relationship, i.e., points where the observed path lengths are identical to the actual path lengths. For this particular community, the sampled path lengths are typically shorter than the actual path lengths.
