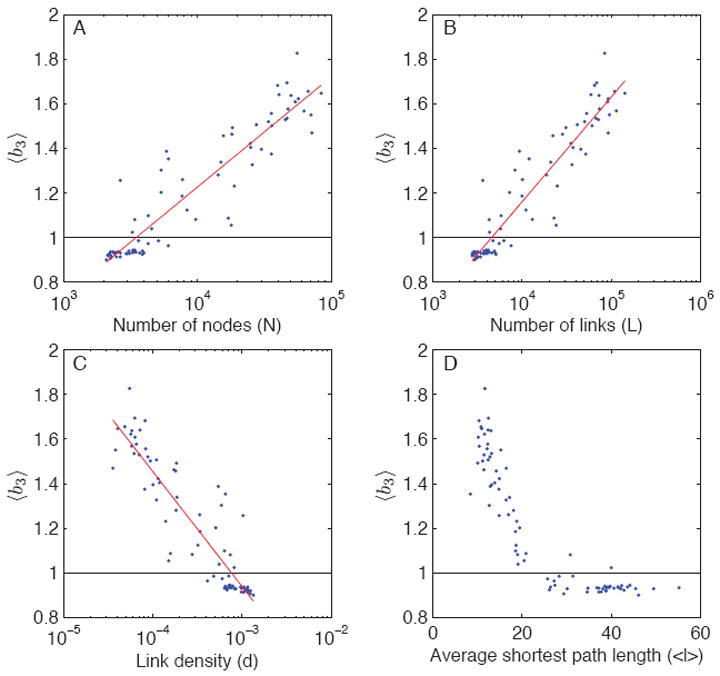
FIG. 9.

(Color online) Average bias-ratios 〈b3〉 (sampled path length divided by dynamic path length) as a function of different network characteristics. The value of 〈b3〉 may be less than one or greater than one, depending on the community network. The horizontal line corresponds to 〈b3〉 = 1.
