Abstract
Purpose.
Hemochromatosis is a disorder of iron overload arising mostly from mutations in HFE. HFE is expressed in retinal pigment epithelium (RPE), and Hfe−/− mice develop age-related iron accumulation and retinal degeneration associated with RPE hyperproliferation. Here, the mechanism underlying the hyperproliferative phenotype in RPE was investigated.
Methods.
Cellular senescence was monitored by β-galactosidase activity. Gene expression was monitored by real-time PCR. Survivin was analyzed by Western blot and immunofluorescence. Migration and invasion were monitored using appropriate kits. Glucose transporters (GLUTs) were monitored by 3-O-methyl-D-glucose uptake. Histone deacetylases (HDACs) were studied by monitoring catalytic activity and acetylation status of histones H3/H4.
Results.
Hfe−/− RPE cells exhibited slower senescence rate and higher survivin expression than wild type cells. Hfe−/− cells migrated faster and showed greater glucose uptake and increased expression of GLUTs. The expression of HDACs and DNA methyltransferase (DNMTs) also was increased. Similarly, RPE cells from hemojuvelin (Hjv)-knockout mice, another model of hemochromatosis, also had increased expression of GLUTs, HDACs, and DNMTs. The expression of Slc5a8 was decreased in Hfe−/− RPE cells, but treatment with a DNA methylation inhibitor restored the transporter expression, indicating involvement of DNA methylation in the silencing of Slc5a8 in Hfe−/− cells.
Conclusions.
RPE cells from iron-overloaded mice exhibit several features of tumor cells: decreased senescence, enhanced migration, increased glucose uptake, and elevated levels of HDACs and DNMTs. These features are seen in Hfe−/− RPE cells as well as in Hjv−/− RPE cells, providing a molecular basis for the hyperproliferative phenotype of Hfe−/− and Hjv−/− RPE cells.
Hfe−/− and Hjv−/− retinal pigment epithelial (RPE) cells exhibit several features of tumor cells: decreased senescence, enhanced migration, increased glucose uptake, and elevated levels of Histone deacetylases and DNA methyltransferase. These biochemical parameters underlie the hyperproliferative phenotype of Hfe-/- and Hjv-/- RPE cells.
Introduction
Hereditary hemochromatosis is an autosomal recessive disorder of iron overload.1–5 Excess iron is toxic because it can undergo Fenton reaction, catalyzing the conversion of H2O2 to hydroxyl radical. Hydroxyl radicals in turn cause lipid peroxidation, DNA strand breaks, and degradation of cellular components resulting in tissue damage.6 Hemochromatosis patients have morbid iron accumulation in various organs, including the liver, pancreas, kidney, heart, and brain resulting in diverse symptoms such as hepatocarcinoma/cirrhosis, diabetes, nephropathy, cardiomyopathy, and pituitary dysfunction.1–3 Most (>85%) cases of hemochromatosis are associated with mutations in HFE [Histocompatability leukocyte antigen class I-like protein involved in iron (FE) homeostasis].7 The clinical symptoms of the disease caused by mutations in HFE begin to appear only at relatively older ages (>50 years). The remaining approximately 15% of mutations occur in hepcidin, hemojuvelin (HJV; also known as HFE2), ferroportin, and transferrin receptor 2 (TfR2), all of which are also important determinants of iron homeostasis.8 Mutations in HJV and hepcidin lead to iron overload at a much younger age, resulting in juvenile hemochromatosis. HFE interacts with β2-microglobulin, and this interaction is obligatory for the presentation of HFE to the cell surface. In the plasma membrane, HFE interacts with transferrin receptors, TfR1 and TfR2, and inhibits cellular iron uptake. Irrespective of the gene that is mutated in hemochromatosis, there is an increase in intestinal absorption of iron, leading to systemic iron overload. The prevalence of hemochromatosis is quite high, with homozygosity for HFE mutations in the range of approximately 1 in 300.7
In the retina, there are many iron-containing proteins that are involved in the phototransduction cascade9,10; hence, it is essential to maintain iron homeostasis for effective functioning of the retina. Apart from reactive oxygen species mediated by photo-oxidation, hemochromatosis patients may have additional oxidative stress due to iron overload in the retina. In the last decade, several studies have shown the expression and function of iron-regulatory proteins in the retina.11–14 Disruption or loss of iron-regulatory proteins results in AMD-like phenotype in mouse retinas.15,16 Recently, we reported age-dependent retinal degeneration in Hfe and Hjv knockout mice.17,18 Interestingly, we found evidence of hypertrophy and hyperproliferation in retinal pigment epithelial cells (RPE) in both of these mouse models of hemochromatosis. Here we report that Hfe−/− RPE cells exhibit several features of tumor cells. These alterations were also found in Hjv−/− RPE cells, indicating that iron overload is the common underlying cause for these phenotypic changes.
Cancer cells are dependent on large amounts of micronutrients like iron for their rapid growth and cell division. There is evidence that high body iron stores increase risk of cancer in humans.19 Cancer cells have an uncontrolled capacity for proliferation, migration and invasion. Increase in glucose uptake and utilization protects cancer cells from starvation. Tumor progression is not only restricted to the above genetic modifications, it also involves epigenetic changes. Histone acetylation mediated by histone acetyltransferases (HATs) induces gene transcription, whereas histone hypoacetylation mediated by histone deacetylases (HDACs) is associated with gene silencing. Altered expression of HDACs has been linked to tumor development since they affect transcription of genes that regulate critical cellular functions such as cell proliferation, cell-cycle regulation, and apoptosis.20 Although hemochromatosis patients have been well documented to have an increased risk in developing tumors, the molecular mechanism by which iron overload leads to increased predisposition to cancer is unknown. In the present study, we found that Hfe−/− RPE cells have a characteristic tumor phenotype such as increased glucose uptake, enhanced migration, upregulation of survivin, and also epigenetic changes that are found in tumor cells. Most of these findings hold true in Hjv−/− RPE cells as well.
Methods
Animals
Breeding pairs of Hfe+/− mice (C56Bl/6 genetic background) were obtained from the Jackson Laboratory (Bar Harbor, ME). Breeding pairs of Hjv+/− mice (Sv129 genetic background) were provided by Nancy Andrews (Duke University School of Medicine, Durham, NC). Genotyping was done to identify wild type, heterozygous, and homozygous mice in the litters. Age-matched and strain-matched wild type and Hfe−/− or Hjv−/− mice were selected from the same litters for comparison studies. All procedures involving mice were approved by the Institutional Committee on Animal Use for Research and Education and performed in accordance with the ARVO Statement for the Use of Animals in Ophthalmic and Vision Research.
Establishment of Primary RPE Cell Cultures from Mouse Eyes
Primary cultures of RPE were prepared as described previously.17,18 Young mouse pups (3- to 4-week-old) were used to establish primary cultures of RPE. Purity of the cultures was verified as described previously by immunodetection of RPE65, a known marker for RPE cells.17
Senescence Assay
Senescence assay was performed in Hfe+/+ and Hfe−/− primary RPE cells during each passage using a commercially available senescence β-galactosidase staining kit (Cell Signaling Technology, Danvers, MA). Development of blue color after incubation with the reagents provided in the kit identifies senescent cells.
Cell Cycle Analysis by Flow Cytometry
Cells were fixed in 50% ethanol, treated with 0.1% sodium citrate, 1 mg/mL RNase A and 50 μg/mL propidium iodide, and then subjected to fluorescence activated cell sorting (FACS Caliber; Becton Dickinson, Franklin Lakes, NJ) analysis to determine the percentage of cells in each phase of the cell cycle.
Migration and Invasion Assay
The migration of Hfe+/+ and Hfe−/− RPE cells toward fetal bovine serum was measured using the QCM cell migration assay kit (Millipore, Billerica, MA). Serum-starved cells were allowed to migrate for 48 hours in a transwell in the presence of serum. After removing the cells on the top of the membrane filter, the inserts were stained with 0.1% crystal violet, washed, and dried. The crystal violet dye retained on the bottom of the filters (representing the cells that migrated to the underside of the membrane filter) was extracted with 10% acetic acid. The absorbance of the extract was measured at 560 nm. Cell invasion assay was performed similarly using the QCM cell invasion assay kit. The inserts used in this assay were coated with ECMatrix (Millipore, Billerica, MA), representing the extracellular matrix. Serum-starved cells were allowed to invade the matrix for 48 hours in a transwell in the presence of serum. After removing the cells on the top of the membrane filter, the inserts were stained with 0.1% crystal violet, washed, and dried. The crystal violet dye retained on the bottom of the filters (representing the cells that invaded the matrix to the underside of the membrane filter) was extracted with 10% acetic acid. The absorbance of the extract was measured at 560 nm.
Real-Time Polymerase Chain Reaction
RNA was isolated from wild type and Hfe−/− or Hjv−/− primary RPE cells in passages three to five, and used for RT-PCR using GeneAmp RT-PCR kit (Applied Biosystems Inc., Carlsbad, CA). Semi-quantitative PCR was performed using Taq polymerase kit (TaKaRa, Shiga, Japan). Real-time amplifications, using SYBR green detection chemistry, were run in triplicates on 96-well reaction plates. The expression levels of target mRNA was quantified by normalizing with the corresponding internal control (18S RNA). Each PCR experiment was repeated at least three times with similar results. The primers for real-time PCR (Table) were designed based on the sequence information available in GenBank (http://www.ncbi.nlm.nih.gov, provided in the public domain by the National Institutes of Health, Bethesda, MD) for mouse cDNAs.
Table. .
The following Primers Were Used for Real-Time PCR
| Survivin | |
| Forward: | 5′-ATCCACTGCCCTACCGAGAA-3′ |
| Reverse: | 5′-CTTGGCTCTCTGTCTGTCCAGTT-3′ |
| Hexokinase II | |
| Forward: | 5′-TTTTGCCAAGCGTCTCCATAAG-3′ |
| Reverse: | 5′-GCCGCTGCCATCCTCAGAGCGGA-3′ |
| Slc6a14 | |
| Forward: | 5′-GCTTCATCCGAGAACTTCCATGTTG-3′ |
| Reverse: | 5′-TTACTATTGGTGTTCTGCTACAGTTTT-3′ |
| Slc5a8 | |
| Forward: | 5′-TGCCATTTCCTTATGGGTAGG-3′ |
| Reverse: | 5′-AGTGGAGTCCTTTCCGCATTA-3′ |
| SGLT1 | |
| Forward: | 5′-TCTGTAGTGGCAAGGGGAAG-3′ |
| Reverse: | 5′-ACAGGGCTTCTGTGTCTTGG-3′ |
| GLUT1 | |
| Forward: | 5′-AGTGTATCCTGTTGCCCTTCT-3′ |
| Reverse: | 5′-CATCGGCTGTCCCTCGAAGC-3′ |
| GLUT2 | |
| Forward: | 5′-CTGGGTCTGCAATTTTGTCA-3′ |
| Reverse: | 5′-TGTAAACAGGGTGAAGACCA-3′ |
| GLUT3 | |
| Forward: | 5′-GACTGCTTCTGAGTGCTGCTA-3′ |
| Reverse: | 5′-CATTGGCGATCTGGTCAACC-3′ |
| GLUT4 | |
| Forward: | 5′-GTCCTCCTGCTTGGCTTCTT-3′ |
| Reverse: | 5′-AGCTGAGATCTGGTCAAACG-3′ |
| HDAC1 | |
| Forward: | 5′-ATTCCTGCGTTCTATTCGCCCAGA-3′ |
| Reverse: | 5′-TTAGCAGTTCCAGGATGGCCAAGA-3′ |
| HDAC2 | |
| Forward: | 5′-GACATATGAGACTGCAGTTGC-3′ |
| Reverse: | 5′-ACCTCCTTCTCCTTCATCCTC-3′ |
| HDAC3 | |
| Forward: | 5′-TGATGACCAGAGTTACAAGCAC-3′ |
| Reverse: | 5′-GGGCAACATTTC GGACAG-3′ |
| HDAC4 | |
| Forward: | 5′-GGAACTCCTAGCACTGAAACAGAAG-3′ |
| Reverse: | 5′-TTCATGCAACTGTGCCTCATG-3′ |
| HDAC5 | |
| Forward: | 5′-TATTCACCATGGCAACGGC-3′ |
| Reverse: | 5′-CTGGAAAGAAGTTCCCGTTGTC-3′ |
| HDAC6 | |
| Forward: | 5′-TGCTGTGACCCCACTATCC-3′ |
| Reverse: | 5′-TTCTGGTGGGCGATAGCGTTCTT-3′ |
| DNMT1 | |
| Forward: | 5′-CCAAGCTCCGGACCCTGGATGTGT-3′ |
| Reverse: | 5′-CGAGGCCGGTAGTAGTCACAGTAG-3′ |
| DNMT3a | |
| Forward: | 5′-GCACCTATGGGCTGCTGCGAAGACG-3′ |
| Reverse: | 5′-CTGCCTCCAATCACCAGGTCGAATG-3′ |
| DNMT3b | |
| Forward: | 5′-CAAGGAGGGCGACAACCGTCCATT-3′ |
| Reverse: | 5′-TGTTGGACACGTCCGTGTAGTGAG-3′ |
| 18S | |
| Forward: | 5′-CGGCTACCACATCCAAGGAA-3′ |
| Reverse: | 5′-GCTGGAATTACCGCGGCT-3′ |
Western Blot
RPE cells in passage four were washed with 0.01 M PBS and lysed in ice cold lysis buffer (50 mM Tris-HCl, pH 7.4, containing 1% Triton X-100, 10 mM EDTA, 2 mM Na3VO4, 0.5% deoxycholate, 10 mM sodium pyrophosphate and 50 mM NaF). Cells were sonicated for 15 to 20 seconds. The cell debris was removed by centrifugation at 10,000g for 10 minutes at 4°C. Protein concentration in the supernatant was determined using the bicinchoninic acid (BCA) assay (Thermo Fisher Scientific, Rockford, IL). The protein levels of survivin, acetylated, and total H3 and H4 in wild type and Hfe−/− RPE cells were assessed by Western blot using specific antibodies. Rabbit polyclonal antibody against survivin was obtained from Novus Biologicals (Littleton, CO). The primary antibodies used for the analysis of H3 and H4 acetylation were as follows: rabbit polyclonal anti-acetyl H3 and anti-acetyl H4, mouse monoclonal anti-H3, and rabbit polyclonal anti-H4 (Millipore). The secondary antibodies used for the detection of the positive bands were goat anti-rabbit IgG labeled with the infrared dye 800CW and goat anti-mouse IgG labeled with the infrared dye 680LT (LICOR Biosciences, Lincoln, NE). The intensities of the bands were quantified using the LICOR Odyssey instrument and the LICOR application software, version 3.0.
Immunofluorescence Analysis
Primary RPE cells were grown on 12-mm coverslips for 24 hours in 24-well cell culture plates at 37°C in a 5% CO2 incubator. Medium was removed and the cells were fixed in ice cold methanol for 10 minutes after air drying. Cells were then washed with 0.01 M PBS (pH 7.4) and blocked with 1×Power Block for 120 minutes. Cells were incubated overnight at 4°C with rabbit polyclonal anti-survivin (1:50 dilution). Sections were rinsed and incubated for 1 hour with goat anti-rabbit IgG coupled to Alexa Fluor 568 (Invitrogen, Grand Island, NY) at a dilution of 1:1000. Coverslips were mounted after staining with Hoechst (Invitrogen) (a nuclear stain) and sections were examined by epifluorescence using an Axioplan-2 microscope, equipped with an HRM camera and the Axiovision imaging program (Carl Zeiss, Thornwood, NY). Negative control cells were treated likewise, but in the absence of the primary antibodies.
Glucose Uptake
Sodium-coupled glucose transport is mediated by SGLTs and sodium-independent transport is mediated by glucose transporters (GLUTs). We routinely measure the activity of GLUTs by cellular uptake oFf [3H]-3-O-methyl-D-glucose, which is a nonmetabolizable analog of glucose. Transport was measured using an uptake buffer in the presence or absence of sodium. The uptake buffer was 25 mM Hepes/Tris (pH 7.5) containing 140 mM NaCl (presence of Na+) or 140 mM N-methyl-D-glucamine (NMDG) chloride (absence of Na+) and 5.4 mM KCl, 1.8 mM CaCl2, and 0.8 mM MgSO4. Uptake was initiated by the addition of 250 μL uptake buffer containing 50 μM cold glucose, spiked with 1 μCi/well [3H]-3-O-methyl D-glucose. Cells were incubated for 2 minutes at 37°C, after which time the buffer was removed, and the cells were washed twice with ice cold uptake buffer. The cells were then solubilized with 0.5 mL 1% SDS/0.2 N NaOH, and radioactivity was determined by liquid scintillation counter. Protein was measured using the BCA assay (Thermo Fisher Scientific). The uptake measured in the presence of NMDG chloride was taken as the Na+-independent uptake whereas the difference between the uptake values obtained in the presence of NMDG chloride and NaCl was taken as the Na+-dependent uptake.
Measurement of HDAC Activity
The measurement of HDAC activity in lysates from Hfe+/+ and Hfe−/− primary RPE cells in passage four was carried out using a commercially available HDAC assay kit (Biovision, Milpitas, CA). This is a colorimetric assay.
Xenograft in Nude Mice
Hfe+/+ and Hfe−/− primary RPE cells were injected subcutaneously on the back of BALB/c nude mice (10 × 106 cells/injection site). Mice were kept under observation for 3 months to analyze tumor progression.
Statistics
Statistical significance was determined by paired Student's t-test. A P value less than 0.05 was taken as statistically significant.
Results
Senescence and Cell Cycle Changes in Hfe−/− RPE Cells
Cellular senescence is an irreversible mechanism of cell cycle arrest in primary cultured cells and has been demonstrated to restrict tumorigenesis in vivo.21,22 We reported previously that Hfe−/− RPE cells are hyperproliferative and continue to grow even after the fifth passage, unlike the Hfe+/+ RPE cells that do not proliferate after passage five.17 In order to determine if there is any difference in the senescence pattern, we compared the activity of senescence-specific β-galactosidase between Hfe+/+ and Hfe−/− RPE cells. There was no difference between the cells of the two genotypes in the number of senescent cells until passage three. However, in passages four and five, there was a significant increase in the number of senescent cells in Hfe+/+ RPE cells compared with Hfe−/− RPE cells. These data indicate that while Hfe+/+ cells undergo senescence after the third passage, Hfe−/− cells do not become senescent and continue to proliferate (Fig. 1A). Also, using FACS analysis, we found that in passages four and five there is a small, but significant, increase in the number of cells in the G2/M phase in Hfe−/− cells compared with Hfe+/+ RPE cells (Fig. 1B), indicating that more number of cells undergo cell division in Hfe−/− cells than in Hfe+/+ RPE cells.
Figure 1. .
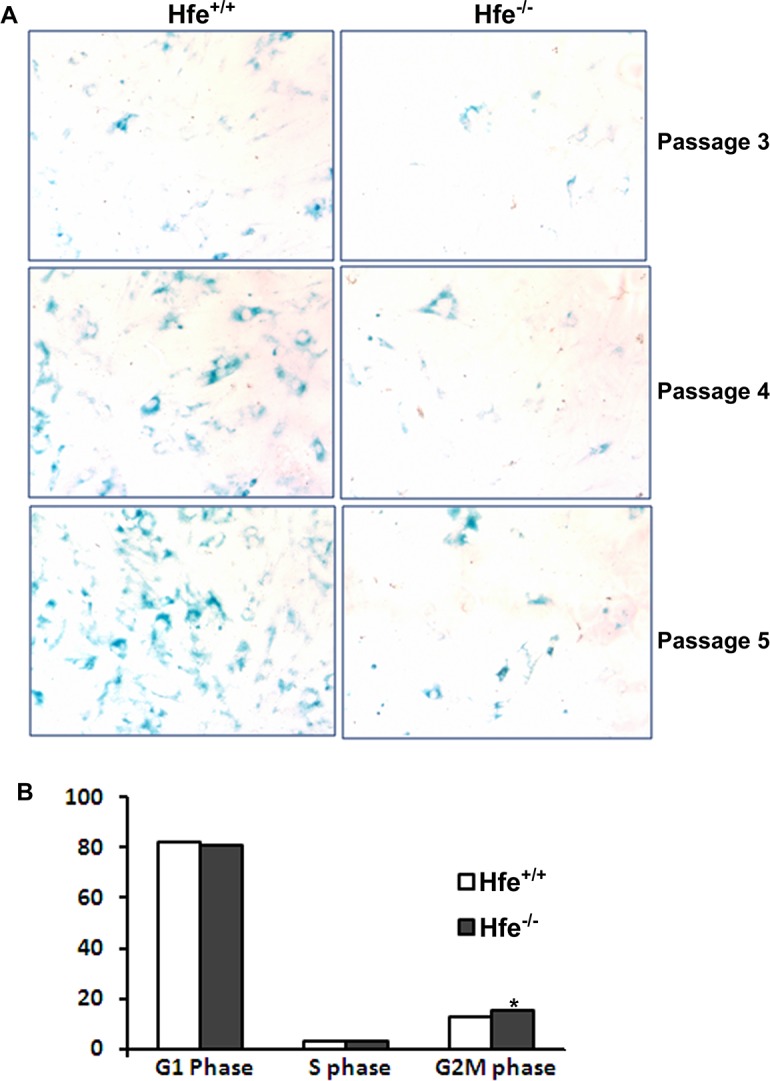
Senescence and cell cycle changes in Hfe−/− primary RPE cells. (A) Senescence assay with Hfe+/+ and Hfe+/+ primary RPE cells. Blue color indicates senescent cells. (B) Flow cytometric analysis of Hfe+/+ and Hfe−/− primary RPE cells stained with propidium iodide. Bar diagram is a representation of the percentage of cells in G0/G1, S, and G2/M phases. *P < 0.05. The experiments were repeated four times.
Upregulation of Survivin in Hfe−/− RPE Cells
Survivin is a member of the inhibitor of apoptosis proteins (IAP) family of molecules that specifically inhibit caspase three, seven, and nine and, thereby, prevent apoptosis.23,24 We found that survivin expression was upregulated in Hfe−/− primary RPE cells at mRNA and protein levels (Figs. 2A, 2B). Immunofluorescence analysis also confirmed this upregulation (Fig. 2C).
Figure 2. .
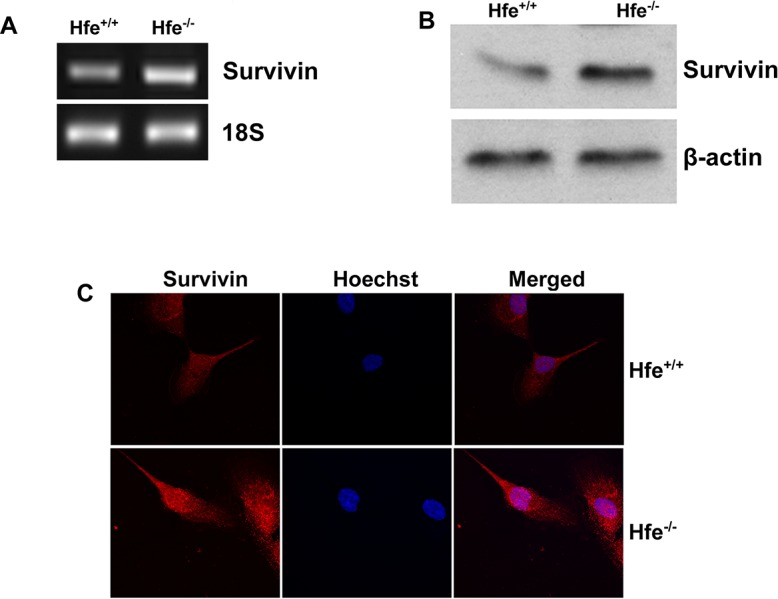
Upregulation of survivin in Hfe−/− primary RPE cells. (A) RT-PCR analysis of survivin mRNA transcripts in Hfe+/+ and Hfe−/− primary RPE cells. 18S RNA was used as an internal control. (B) Western blot for survivin protein in Hfe+/+ and Hfe−/− primary RPE cells. β-Actin was used as a loading control. (C) Immunostaining for survivin in Hfe+/+ and Hfe−/− primary RPE cells.
Migratory and Invasive Properties of Hfe−/− RPE Cells
The ability of a cancer cell to undergo migration and invasion allows it to not only move to the surrounding tissues, but also to metastasize to distant organs. In the present study, we grew Hfe+/+ and Hfe−/− RPE cells in serum-free medium in the upper chamber of transwells, and stained the cells that migrated to the underside of the membrane facing the lower chamber exposed to serum (Fig. 3A). The staining was then quantified by dissolving the dye in 10% acetic acid (Figs. 3B, 3C). We found that Hfe−/− cells exhibited a much greater migratory capability than Hfe+/+ cells. Interestingly, there was no difference in the invasive property between the cells of the two genotypes.
Figure 3. .
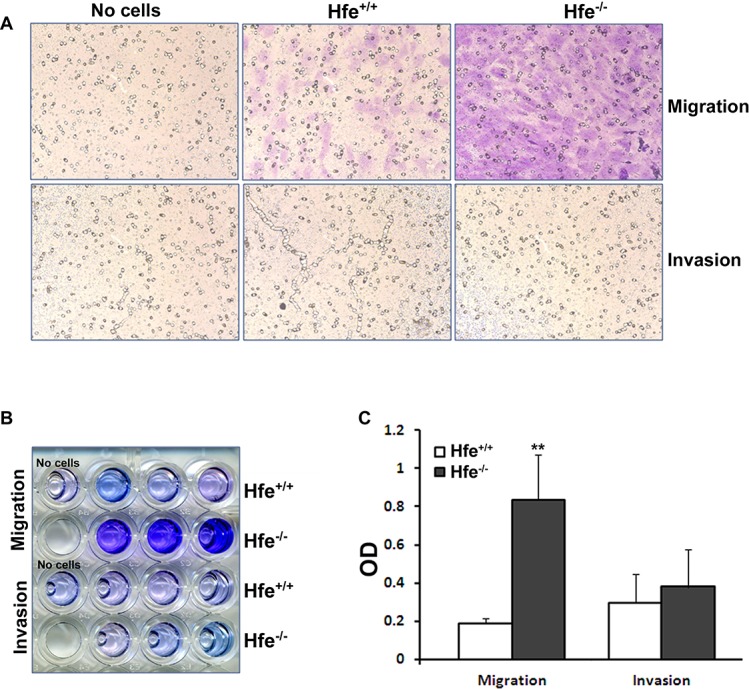
Migration and invasion assays with Hfe+/+ and Hfe−/− primary RPE cells. (A) Representative micrograph images of cells stained after migration and invasion assays in Hfe+/+ and Hfe−/− primary RPE cells at passage four. Far left panel shows the well where no cells were seeded, middle panel represents Hfe+/+cells and the far right panel Hfe−/− primary RPE cells. (B) The cells that moved to the trans side of the filter were stained, and the dye was dissolved in 10% acetic acid and collected in 96-well plates. (C) The optical density (OD) of the dye extract was determined at 560 nm. **P < 0.01. The experiments were repeated thrice with similar results.
Increase in Glucose Uptake by Hfe−/− RPE Cells
Cancer cells alter their metabolism in order to support their rapid proliferation. Sodium-coupled glucose transporters (SGLTs) and facilitative GLUTs are upregulated to increase the uptake of glucose by cancer cells.25–27 We found that SGLT1, GLUT1, and GLUT3 were upregulated at mRNA level in Hfe−/− RPE cells (Fig. 4A). To determine if there is a functional increase in glucose uptake by Hfe−/− RPE cells compared with Hfe+/+ cells, we performed [3H]-3-O-methyl D-glucose uptake studies. Glucose gets metabolized inside the cells quickly and, hence, we used [3H]-3-O-methyl D-glucose, a glucose derivative that is nonmetabolizable, to measure the function of glucose transporters. In the absence of sodium, there was a significant increase in glucose uptake by Hfe−/− cells irrespective of the passage number used (Fig. 4B), indicating an increase in the activity of facilitative glucose transporters (GLUT1 and GLUT3). There was also an increase in glucose uptake by Hfe−/− RPE cells when measured in the presence of sodium. When the sodium-dependent uptake was analyzed separately (i.e., uptake in the presence of sodium minus uptake in the absence of sodium), the uptake was higher in Hfe−/− RPE cells than in Hfe+/+ cells (Fig. 4C), indicating an increase in the activity of SGLT1 in Hfe−/− RPE cells. Glucose is metabolized in cancer cells by hexokinase II, the first enzyme in the glycolytic pathway; this particular isoenzyme is upregulated in some cancers.28 However, we did not find any change in the mRNA levels of hexokinase II between the RPE cells of the two genotypes (Fig. 5A).
Figure 4. .
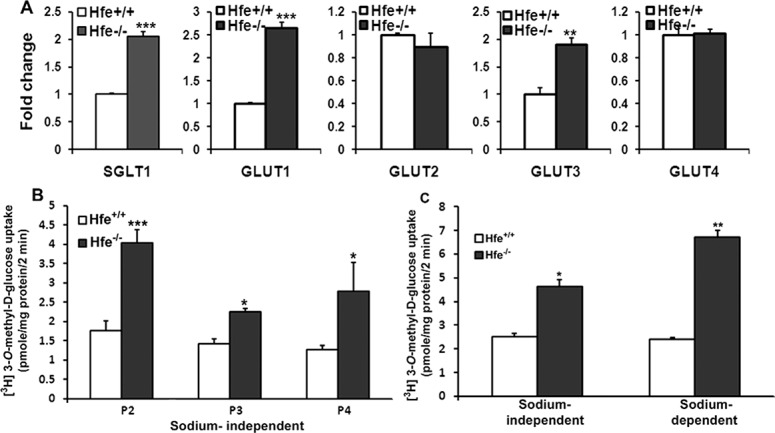
Upregulation of glucose transporters in Hfe−/− primary RPE cells. (A) Real-time PCR analysis showing mRNA levels of sodium-coupled glucose transporter SGLT1 and facilitative glucose transporters (GLUT1-4) in Hfe+/+ and Hfe−/− RPE cells from passage three or four. (B) Uptake of [3H]-3-O-methyl-D-glucose was measured in passage two, three, and four (P2, P3, and P4) in Hfe+/+ and Hfe−/− RPE cells. Uptake was measured for 2 minutes at 37°C in the absence of Na+ with 1 μCi/well of [3H] 3-O-methyl-D-glucose and 50-μM unlabeled glucose. NMDG chloride was used to substitute for NaCl in the uptake medium. (C) Na+-independent and Na+-dependent uptakes of [3H]-3-O-methyl-D-glucose were also measured in Hfe+/+ and Hfe−/− RPE cells (P2). *P < 0.05; **P < 0.01; ***P < 0.001.
Figure 5. .
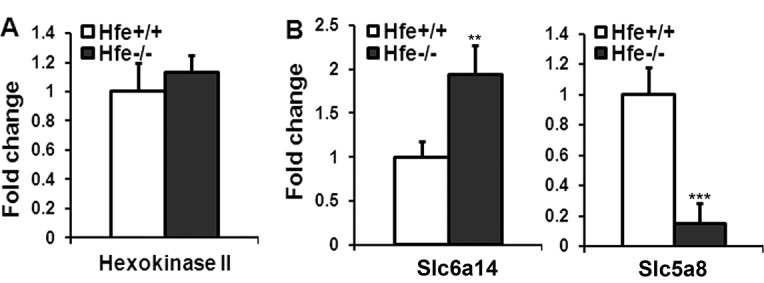
Differential expression of hexokinase II, Slc6a14, and Slc5a8 in Hfe+/+ and Hfe−/− primary RPE cells. (A) Real-time PCR analysis of mRNA transcripts specific for hexokinase II in Hfe+/+ and Hfe−/− RPE cells (P3). (B) Real-time PCR analysis of mRNA transcripts specific for Slc6a14 and Slc5a8 in Hfe+/+ and Hfe−/− RPE cells. 18S RNA was used as an internal control. **P < 0.01; ***P < 0.001.
Differential Expression of Slc6a14 and Slc5a8 in Hfe−/− RPE Cells
Slc6a14 is an amino acid transporter with broad substrate selectivity. Tumor cells have an increased requirement for essential amino acids as well as arginine and glutamine to support their rapid growth and hence this transporter is upregulated in many tumors.29,30 We found that Slc6a14 was upregulated in Hfe−/− RPE cells compared with Hfe+/+ RPE cells (Fig. 5B). SLC5A8 encodes a sodium-coupled monocarboxylate transporter for endogenous monocarboxylates such as butyrate and pyruvate. SLC5A8 is a tumor suppressor, and epigenetic silencing of SLC5A8 involving promoter hypermethylation is seen in many cancers.31,32 In this study, we found that Slc5a8 was downregulated significantly in Hfe−/− RPE cells compared with wild type cells (Fig. 5B).
Epigenetic Modifications in Hfe−/− RPE Cells
HDACs are key enzymes that deacetylate histones, thereby regulating important cell processes such as cell-cycle progression and apoptosis. Increase in HDAC activity is seen in a variety of cancers.33,34 We found upregulation of HDAC 1-3 mRNA in Hfe−/− RPE cells (Fig. 6A). The total HDAC enzyme activity was also higher in Hfe−/− RPE cells (Fig. 6B). Although HDAC activity was higher in Hfe−/− RPE cells, unexpectedly the ratios of acetylated H3 and H4 levels to β-actin were also higher in Hfe−/− RPE cells than in Hfe+/+ RPE cells. Interestingly, the total H3 and H4 protein levels also increased in Hfe−/− RPE cells (Fig. 6C). However, the ratios of acetyl H3 and H4 to total H3 and H4, respectively, were lower in Hfe−/− RPE cells compared with the Hfe+/+ cells as expected to concur with the increase in HDAC activity (Fig. 6D).
Figure 6. .
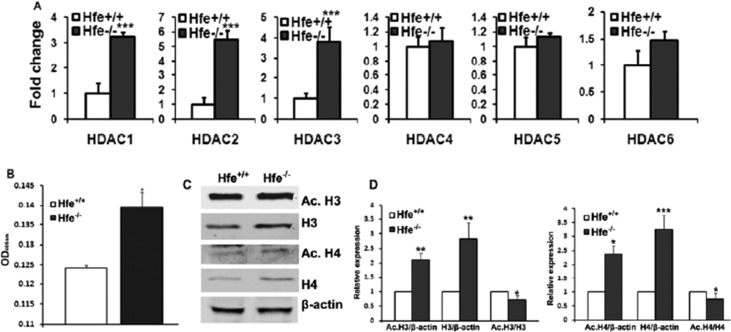
Epigenetic changes in Hfe−/− primary RPE cells. (A) Real-time PCR analysis of HDAC1, 2, 3, 4, 5, and 6 mRNA levels in Hfe+/+ and Hfe−/− primary RPE cells (P4). (B) Total HDAC activity was measured in Hfe+/+ (WT) and Hfe−/− (KO) primary RPE cells from P4. (C) Western blot analysis showing acetyl-H3 and H4, total H3 and H4 with β-actin as a loading control. (D) Bar diagram showing the ratios of intensity of acetyl H3 and H4 to total H3 and H4 and the ratio of intensity of acetyl H3 and H4 to β-actin. *P < 0.05; **P < 0.01; ***P < 0.001.
DNA methyltransferase (DNMT) family of enzymes catalyzes the transfer of the methyl group from S-adenosylmethionine to DNA. Three active DNMTs have been identified in mammals, namely, DNMT1, DNMT3a, and DNMT3b. DNMTs are upregulated in many cancers resulting in hypermethylation of tumor suppressor genes and their consequent inactivation.35 We found that Hfe−/− RPE cells upregulate DNMT1 and DNMT3a at mRNA level (Fig. 7A). It has been well established that silencing of SLC5A8 is associated with DNA methylation and that treatment of cancer cells with DNA-demethylating agents re-actives SLC5A8 expression.31,32 Therefore, we treated Hfe+/+ and Hfe−/− RPE cells with 5-aza-2-deoxycytidine (5-Azadc), a DNA-demethylating agent, and monitored Slc5a8 expression (Fig. 7B). Treatment with 5-Azadc did not alter Slc5a8 expression in Hfe+/+ RPE cells whereas it re-activated Slc5a8 expression in Hfe−/− RPE cells similar to cancer cells.
Figure 7. .
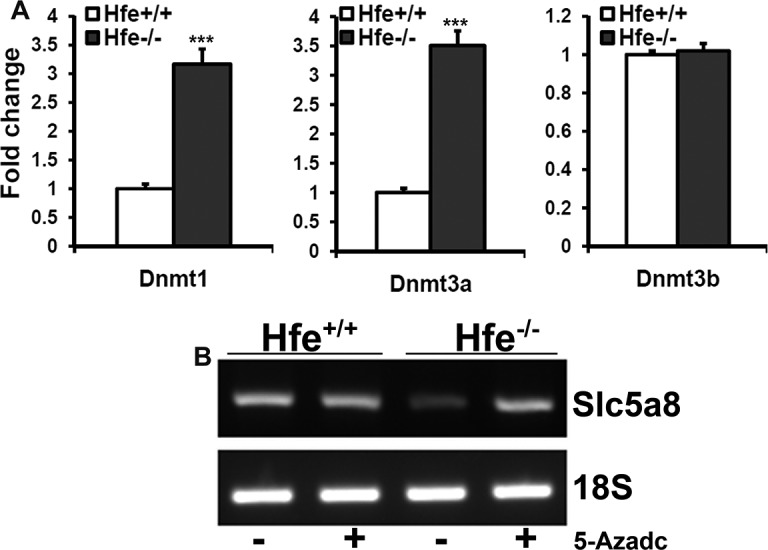
Expression analysis of DNMTs in Hfe+/+ and Hfe−/− RPE cells. (A) Real-time PCR analysis for the levels of DNMT1, DNMT3a, and DNMT3b mRNAs in Hfe+/+ and Hfe−/− RPE cells (P3). (B) RT-PCR analysis for the levels of Slc5a8 mRNA in Hfe+/+ and Hfe−/− RPE cells, which had been treated with 5-aza-2-deoxycytidine (5-Azadc; 2 μg/mL) for 72 hours.
Tumor Phenotype in Hjv−/− Primary RPE cells
Hjv is another important iron-regulatory protein that is expressed extensively in different cell types of retina.14 We have already reported hypertrophy and hyperproliferation in RPE of both Hfe and Hjv knockout mouse models of hemochromatosis.17,18 To confirm that the molecular and biochemical changes found in Hfe−/− RPE cells hold true also in RPE cells from another mouse model of iron overload, we checked the expression levels of GLUTs, HDACs, and DNMTs in Hjv−/− mouse primary RPE cells. We found that GLUT1, GLUT3, and SGLT1 were significantly upregulated in Hjv−/− RPE cells (Fig. 8A). Similarly, we found an upregulation in the expression of HDAC1, 2, 3, and 6 in Hjv−/− RPE cells. However, there was no significant change in the levels of HDAC4 and 5 (Fig. 8B). We also found a robust upregulation of DNMT1 and 3a in Hjv−/− RPE cells (Fig. 8C).
Figure 8. .
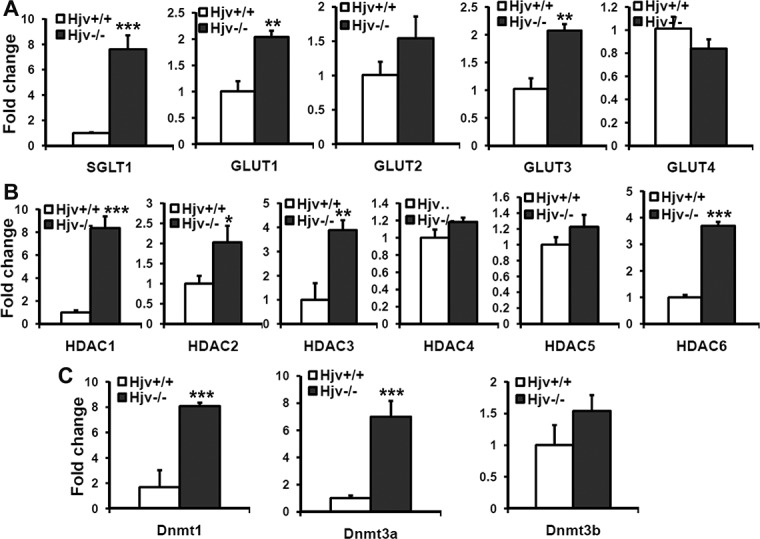
Changes in the expression of glucose transporters, histone deacetylases, and DNMTs in Hjv−/− primary RPE cells. (A) Real-time PCR analysis for mRNAs of SGLT1 and GLUTs (A), HDACs (B), and DNMTs (C) in Hjv+/+ and Hjv−/− RPE cells (P4). The experiments were repeated three times, and 18S RNA was used as the internal control.
Inability of Hfe−/− RPE Cells to Form Tumors in Nude Mice
Since deletion of Hfe in RPE cells induces many biochemical and genetic features that are characteristic of tumor cells, we were interested to find out if these alterations are sufficient for malignant transformation. Therefore, we examined the ability of Hfe−/− RPE cells to form tumors when xenografted into athymic nude mice. We found no evidence of tumor formation even after 3 months following subcutaneous injection of these cells in nude mice (data not shown). This indicates that though Hfe−/− RPE cells exhibit several characteristic features of tumor cells, they are not malignant and are unable to grow into tumors.
Discussion
Our previous studies show clear evidence of focal areas of RPE hyperproliferation in hemochromatosis mouse models of iron overload.17,18 We also found that primary cultures of RPE from these mouse models are hyperproliferative in vitro. We carried out the present study to understand the molecular aspects of this phenotype. In each cycle of cell division, chromosomes replicate in S-phase and then segregate to create two genetically identical daughter cells in M-phase. Cell cycle checkpoints signal abnormalities in critical events such as DNA replication and chromosome segregation. Any dysregulation in these checkpoints may result in unrestricted cell cycle and hyperproliferative phenotype. The present findings indicate that Hfe−/− RPE cells showed a small, but significant, increase in the percentage of cells in the Gap 2/mitosis phase (G2M) compared with Hfe+/+ cells. This indicated that deletion of Hfe in RPE cells enhances the cell proliferation rate, but only to a small extent. However, there was a marked decrease in senescence and increase in the expression of the anti-apoptotic protein survivin in Hfe−/− cells compared with wild type cells. Survivin is known to be a multifunctional protein that can regulate cell division, enhance angiogenesis and inhibit apoptosis.36 Survivin is upregulated in many cancers and is hardly expressed in terminally differentiated tissues.37 Due to its significant role as an inhibitor of apoptotic cell death, we believe that the upregulation of survivin expression observed in Hfe−/− primary RPE cells protects the cells from apoptosis. Thus, it appears that the increased proliferation rate observed in Hfe−/− RPE cells is mostly due to changes in the senescence rate and apoptosis, with only a small contribution from increased cell division.
To spread within the tissues, tumor cells use migration mechanisms that are not identical but are similar to those that occur in normal cells during physiological processes such as embryonic development, wound healing, and immune-cell trafficking.38 Substantial increase in the migration of Hfe−/− RPE cells compared with the control cells observed in the present study demonstrates the propensity of the Hfe−/− RPE cells toward tumor phenotype. Cells undergo genetic, metabolic, and epigenetic alterations to become cancerous. In the present study, we found many of these changes in Hfe−/− RPE cells. Slc5a8 is a well known tumor suppressor silenced in many tumors and is downregulated in Hfe−/− RPE cells. Similarly, Slc6a14, a tumor promoter, is upregulated in Hfe−/− RPE cells, indicating that these genetic modifications are likely to play a significant role in the hyperproliferative phenotype. It has been known for decades that cancer cells require high levels of glucose to fulfill their energy requirements. Our findings that Hfe−/− RPE cells have increased levels of glucose uptake and utilization confirm the metabolic changes that occur in these cells that are congruent with those found in tumor cells.
DNA methylation, specifically silencing of tumor-suppressor genes by promoter hypermethylation, has been one of the most widely studied epigenetic modifications in human cancers.35 However, in recent years there has been a significant understanding in our knowledge about the involvement of abnormal histone modifications, especially with regard to the acetylation status in cancer development. Acetylation levels of histone are the result of a balance between the activities of HATs and HDACs.39 The presence of acetylated lysine in histones is associated with a relaxed chromatin and active gene transcription, while the deacetylation of lysine residues results in a condensed chromatin and transcriptional gene inactivation.33,34 We not only found an increase in the HDAC activity in Hfe−/− RPE cells, but also found that histone protein levels are upregulated in these cells. Eukaryotic chromosome replication requires synthesis of not only DNA, but also histone proteins needed to package the newly replicated DNA into a chromatin. In most cells, the synthesis of histones is tightly coupled with the rate of DNA replication. Since Hfe−/− RPE cells proliferate faster than control cells, it is plausible that total histone levels increase in Hfe−/− cells to package the replicating DNA. Other studies have shown that overexpression of integrated genes encoding histones H3/H4, but not H2A/H2B, extends the median life span of normal cells by 30%.40 Thus, increase in the total H3 and H4 histone levels may also play a role in reducing the senescence in Hfe−/− RPE cells.
Thus, the present study shows convincingly that deletion of Hfe in RPE cells leads to a broad spectrum of biochemical and genetic changes resulting in features that are characteristic of tumor cells. These changes, including increased glucose uptake, overexpression of the amino acid transporter Slc6a14, increased expression of HDACs and DNMTs, overexpression of the anti-apoptotic protein survivin, and decreased senescence, underlie the hyperproliferative phenotype observed in these cells. A similar phenomenon is also seen in RPE cells upon deletion of Hjv, another iron-regulatory protein. In humans as well as in mice, deletion of Hfe or Hjv leads to abnormal accumulation of iron in systemic circulation as well as in several organs, including the retina. Thus, iron overload is likely to be the common trigger for the observed biochemical and genetic alterations in Hfe−/− and Hjv−/− RPE cells. However, the molecular events linking the excessive iron to the tumor phenotype in these cells remain unknown. Iron overload is known to increase the production of reactive oxygen species, which not only cause oxidative stress but also serve as important signaling molecules. Iron is also obligatory for epigenetic modifications as many of the DNA demethylases contain iron at their active site. Since the biological role of iron is so widespread, it is difficult at this point to speculate on the most plausible mechanisms by which excessive iron induce a tumor phenotype in RPE cells. However, RPE hypertrophy observed in other mouse models suggests iron-induced oxidative stress is most likely to be the trigger for the hyperproliferative phenotype in this cell. In addition to our own studies on Hfe−/− and Hjv−/− mice, in which excessive iron accumulation in the retina is associated with RPE hypertrophy,17,18 four other mouse models have been described in the literature with a similar phenotype: ceruloplasmin/hephaestin double-knockout mouse,16 hepcidin knockout mouse,41 BMP6−/− knockout mouse,42 and mouse with postnatal ablation of RPE mitochondrial phosphorylation.43 Oxidative stress is a common factor in all these mouse models, pinpointing its role as a potential cause of RPE hypertrophy. It is important to mention here that even though deletion of Hfe in RPE cells induces various biochemical and genetic features that are observed in tumor cells, Hfe−/− RPE cells are not malignant and do not form tumors when xenografted into athymic nude mice. Based on these data, it seems that excessive iron accumulation in tissues itself is not sufficient to cause cancer, but it seems very likely that excessive iron accumulation might facilitate tumor progression. Since hemochromatosis is a genetic disorder of iron overload with high prevalence in humans, this disease might be a significant promoter of tumor development and growth.
Footnotes
Supported by a grant from the National Eye Institute (EY019672).
Disclosure: J.P. Gnana-Prakasam, None; R. Veeranan-Karmegam, None; V. Coothankandaswamy, None; S.K. Reddy, None; P.M. Martin, None; M. Thangaraju, None; S.B. Smith, None; V. Ganapathy, None
References
- 1. Donovan A, Andrews NC. The molecular regulation of iron metabolism. Hematol J. 2004; 5: 373–380 [DOI] [PubMed] [Google Scholar]
- 2. Fleming RE, Britton RS, Waheed A, Sly WS, Bacon BR. Pathophysiology of hereditary hemochromatosis. Semin Liver Dis. 2005; 25: 411–419 [DOI] [PMC free article] [PubMed] [Google Scholar]
- 3. Beutler E. Hemochromatosis: genetics and pathophysiology. Annu Rev Med. 2006; 57: 331–347 [DOI] [PubMed] [Google Scholar]
- 4. Ganz T, Nemeth E. Hepcidin and regulation of body iron metabolism. Am J Physiol. 2006; 290: G199–G203 [DOI] [PubMed] [Google Scholar]
- 5. Fleming RE, Britton RS. Iron Imports. VI. HFE and regulation of intestinal iron absorption. Am J Physiol. 2006; 290: G590–G594 [DOI] [PubMed] [Google Scholar]
- 6. Halliwell B, Gutteridge JM. Oxygen toxicity, oxygen radicals, transition metals and disease. Biochem J. 1984; 219: 1–14 [DOI] [PMC free article] [PubMed] [Google Scholar]
- 7. Feder JN, Gnirke A, Thomas W, et al. A novel MHC class I-like gene is mutated in patients with hereditary haemochromatosis. Nat Genet. 1996; 13: 399–408 [DOI] [PubMed] [Google Scholar]
- 8. Wallace DF, Subramaniam VN. Non-HFE haemochromatosis. World J Gastroenterol. 2007; 13: 4690–4698 [DOI] [PMC free article] [PubMed] [Google Scholar]
- 9. Moiseyev G, Chen Y, Takahashi Y, Wu BX, Ma JX. RPE65 is the isomerohydrolase in the retinoid visual cycle. Proc Natl Acad Sci U S A. 2005; 102: 12413–12418 [DOI] [PMC free article] [PubMed] [Google Scholar]
- 10. Chen H, Lukas TJ, Du N, Suyeoka G, Neufeld AH. Dysfunction of the retinal pigment epithelium with age: increased iron decreases phagocytosis and lysosomal activity. Invest Ophthalmol Vis Sci. 2009; 50: 1895–1902 [DOI] [PubMed] [Google Scholar]
- 11. Dentchev T, Hahn P, Dunaief JL. Strong labeling for iron and the iron-handling proteins ferritin and ferroportin in the photoreceptor layer in age-related macular degeneration. Arch Ophthalmol. 2005; 123: 1745–1746 [DOI] [PubMed] [Google Scholar]
- 12. Martin PM, Gnana-Prakasam JP, Roon P, Smith RG, Smith SB, Ganapathy V. Expression and polarized localization of the hemochromatosis gene product HFE in the retinal pigment epithelium. Invest Ophthalmol Vis Sci. 2006; 47: 4238–4244 [DOI] [PubMed] [Google Scholar]
- 13. Gnana-Prakasam JP, Martin PM, Mysona BA, Roon P, Smith SB, Ganapathy V. Hepcidin expression in mouse retina and its regulation via lipopolysaccharide/Toll-like receptor-4 pathway independent of Hfe. Biochem J. 2008; 411: 79–88 [DOI] [PMC free article] [PubMed] [Google Scholar]
- 14. Gnana-Prakasam JP, Martin PM, Zhang M, Atherton SS, Smith SB, Ganapathy V. Expression of the iron-regulatory protein haemojuvelin in retina and its regulation during cytomegalovirus infection. Biochem J. 2009; 419: 533–543 [DOI] [PubMed] [Google Scholar]
- 15. Hahn P, Qian Y, Dentchev T, et al. Disruption of ceruloplasmin and hephaestin in mice causes retinal iron overload and retinal degeneration with features of age-related macular degeneration. Proc Natl Acad Sci U S A. 2004; 101: 13850–13855 [DOI] [PMC free article] [PubMed] [Google Scholar]
- 16. Hadziahmetovic M, Dentchev T, Song Y, et al. Ceruloplasmin/hephaestin knockout mice model morphologic and molecular features of AMD. Invest Ophthalmol Vis Sci. 2008; 49: 2728–2736 [DOI] [PMC free article] [PubMed] [Google Scholar]
- 17. Gnana-Prakasam JP, Thangaraju M, Liu K, Martin PM, Smith SB, Ganapathy V. Absence of iron-regulatory protein HFE results in hyperproliferation of retinal pigment epithelium mediated by induction of cystine/glutamate transporter. Biochem J. 2009; 424: 243–252 [DOI] [PMC free article] [PubMed] [Google Scholar]
- 18. Gnana-Prakasam JP, Tawfik A, Romej M, et al. Iron-mediated retinal degeneration in haemojuvelin-knockout mice. Biochem J. 2011; 441: 599–608 [DOI] [PMC free article] [PubMed] [Google Scholar]
- 19. Selby JV, Friedman GD. Epidemiologic evidence of an association between body iron stores and risk of cancer. Int J Cancer. 1988; 41: 677–682 [DOI] [PubMed] [Google Scholar]
- 20. Ropero S, Esteller M. The role of histone deacetylases (HDACs) in human cancer. Mol Oncol. 2007; 1: 19–25 [DOI] [PMC free article] [PubMed] [Google Scholar]
- 21. Chen Z, Trotman LC, Shaffer D, et al. Crucial role of p53-dependent cellular senescence in suppression of Pten-deficient tumorigenesis. Nature. 2005; 436: 725–730 [DOI] [PMC free article] [PubMed] [Google Scholar]
- 22. Campisi J. Cellular senescence as a tumor-suppressor mechanism. Trends Cell Biol. 2001; 11: S27–S31 [DOI] [PubMed] [Google Scholar]
- 23. Deveraux QL, Reed JC. IAP family proteins—suppressors of apoptosis. Genes Dev. 1999; 13: 239–252 [DOI] [PubMed] [Google Scholar]
- 24. Cheung H, LaCasse EC, Korneluk RG. XIAP antagonism: strategies in cancer treatment. Clin Cancer Res. 2006; 12: 3238–3242 [DOI] [PubMed] [Google Scholar]
- 25. Calvo TB, Figueroa A, Pulido EG, Campelo RG, Aparicio LA. Potential role of sugar transporters in cancer and their relationship with anticancer therapy. Int J Endocrinol. 2010; 2010; pii:205357 [DOI] [PMC free article] [PubMed] [Google Scholar]
- 26. Matsuzu K, Segade F, Matsuzu U, Carter A, Bowden DW, Perrier ND. Differential expression of glucose transporters in normal and pathologic thyroid tissue. Thyroid. 2004; 14: 806–812 [DOI] [PubMed] [Google Scholar]
- 27. Chan DA, Sutphin PD, Nguyen P, et al. Targeting GLUT1 and the Warburg effect in renal cell carcinoma by chemical synthetic lethality. Sci Transl Med. 2011; 3: 94ra70 [DOI] [PMC free article] [PubMed] [Google Scholar]
- 28. Mathupala SP, Ko YH, Pedersen PL, Hexokinase II: Cancer's double-edged sword acting as both facilitator and gatekeeper of malignancy when bound to mitochondria. Oncogene. 2006; 25: 4777–4786 [DOI] [PMC free article] [PubMed] [Google Scholar]
- 29. Gupta N, Miyauchi S, Martindale RG, et al. Upregulation of the amino acid transporter ATB0,+ (SLC6A14) in colorectal cancer and metastasis in humans. Biochim Biophys Acta. 2005; 1741: 215–223 [DOI] [PubMed] [Google Scholar]
- 30. Gupta N, Prasad PD, Ghamande S, et al. Up-regulation of the amino acid transporter ATB0,+ (SLC6A14) in carcinoma of the cervix. Gynecol Oncol. 2006; 100: 8–13 [DOI] [PubMed] [Google Scholar]
- 31. Ganapathy V, Thangaraju M, Gopal E, et al. Sodium-coupled monocarboxylate transporters in normal tissue and in cancer. AAPS J. 2008; 10: 193–199 [DOI] [PMC free article] [PubMed] [Google Scholar]
- 32. Ganapathy V, Thangaraju M, Prasad PD. Nutrient transporters in cancer: relevance to Warburg hypothesis and beyond. Pharmacol Ther. 2009; 121: 29–40 [DOI] [PubMed] [Google Scholar]
- 33. Johnstone RW. Histone-deacetylase inhibitors: novel drugs for the treatment of cancer. Nat Rev Drug Discov. 2002; 1: 287–299 [DOI] [PubMed] [Google Scholar]
- 34. Iizuka M, Smith MM. Functional consequences of histone modifications. Curr Opin Genet Dev. 2003; 13: 154–160 [DOI] [PubMed] [Google Scholar]
- 35. Rountree MR, Bachman KE, Herman JG, Baylin SB. DNA methylation, chromatin inheritance, and cancer. Oncogene. 2001; 20: 3156–3165 [DOI] [PubMed] [Google Scholar]
- 36. Altieri DC. Validating survivin as a cancer therapeutic target. Nat Rev Cancer. 2003; 3: 46–54 [DOI] [PubMed] [Google Scholar]
- 37. Li F. Survivin study: what is the next wave? J Cell Physiol. 2003; 197: 8–29 [DOI] [PubMed] [Google Scholar]
- 38. Geho DH, Bandle RW, Clair T, Liotta LA. Physiological mechanisms of tumor-cell invasion and migration. Physiology (Bethesda). 2005; 20: 194–200 [DOI] [PubMed] [Google Scholar]
- 39. Ropero S, Esteller M. The role of histone deacetylases (HDACs) in human cancer. Mol Oncol. 2007; 1: 19–25 [DOI] [PMC free article] [PubMed] [Google Scholar]
- 40. Feser J, Truong D, Das C, et al. Elevated histone expression promotes life span extension. Mol Cell. 2010; 39: 724–735 [DOI] [PMC free article] [PubMed] [Google Scholar]
- 41. Hadziahmetovic M, Song Y, Ponnuru P, et al. Age-dependent retinal iron accumulation and degeneration in hepcidin knockout mice. Invest Ophthalmol Vis Sci. 2011; 52: 109–118 [DOI] [PMC free article] [PubMed] [Google Scholar]
- 42. Hadziahmetovic M, Song Y, Wolkow N, et al. Bmp6 regulates retinal iron homeostasis and has altered expression in age-related macular degeneration. Am J Pathol. 2011; 179: 335–348 [DOI] [PMC free article] [PubMed] [Google Scholar]
- 43. Zhao C, Yasumura D, Li X, et al. mTOR-mediated dedifferentiation of the retinal pigment epithelium initiates photoreceptor degeneration in mice. J Clin Invest. 2011; 121: 369–383 [DOI] [PMC free article] [PubMed] [Google Scholar]


