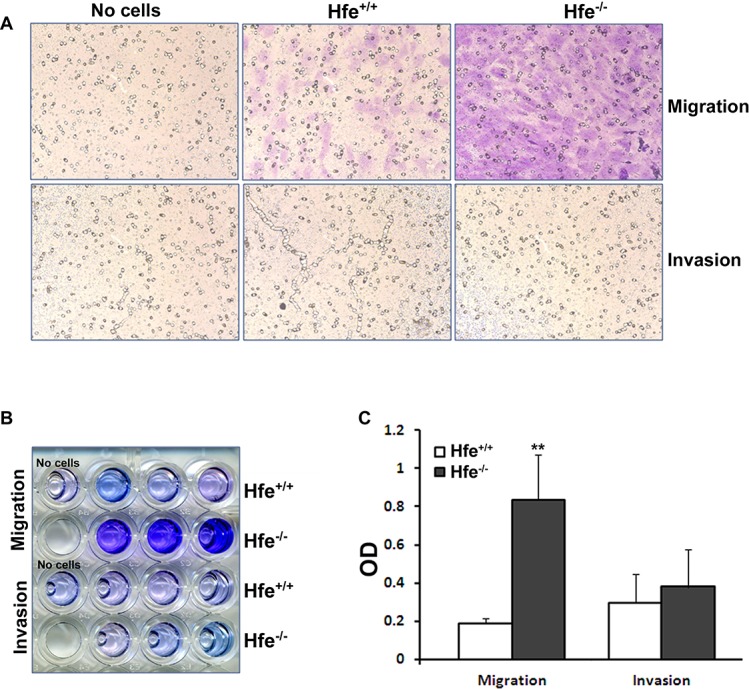
Figure 3. .

Migration and invasion assays with Hfe+/+ and Hfe−/− primary RPE cells. (A) Representative micrograph images of cells stained after migration and invasion assays in Hfe+/+ and Hfe−/− primary RPE cells at passage four. Far left panel shows the well where no cells were seeded, middle panel represents Hfe+/+cells and the far right panel Hfe−/− primary RPE cells. (B) The cells that moved to the trans side of the filter were stained, and the dye was dissolved in 10% acetic acid and collected in 96-well plates. (C) The optical density (OD) of the dye extract was determined at 560 nm. **P < 0.01. The experiments were repeated thrice with similar results.
