
Figure 1.
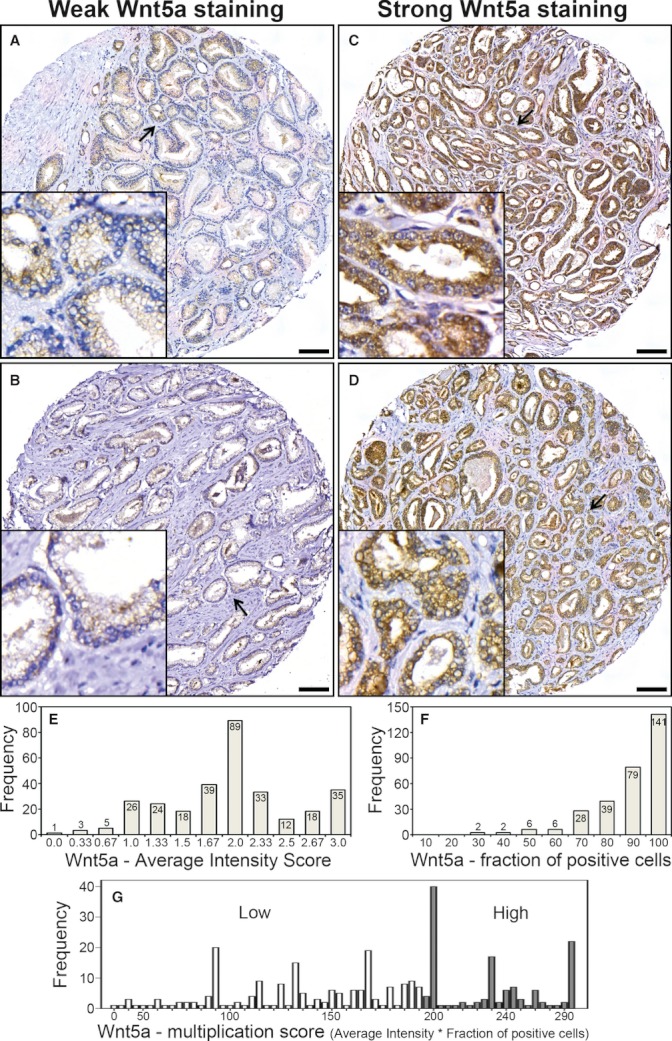
Wnt5a immunostaining in prostate cancer. (A) and (B) illustrate representative examples of weak Wnt5a protein expression, whereas (C) and (D) show strong Wnt5a protein expression in tissue microarray cores of primary prostate tumors obtained after radical prostatectomy. All inserts in the panels represent higher magnifications of selected areas (arrows) (bars 100 μm). (E) and (F) are histograms showing Wnt5a staining average intensity score (scale 0–3) and fraction of Wnt5a-positive cells (scale 10–100), respectively. In (G), distribution Wnt5a expression is illustrated as low or high multiplication score (average intensity score × fraction of Wnt5a-positive cells) from 0 to 300 with a cut-off at 195 as identified by classification and regression tree analysis.