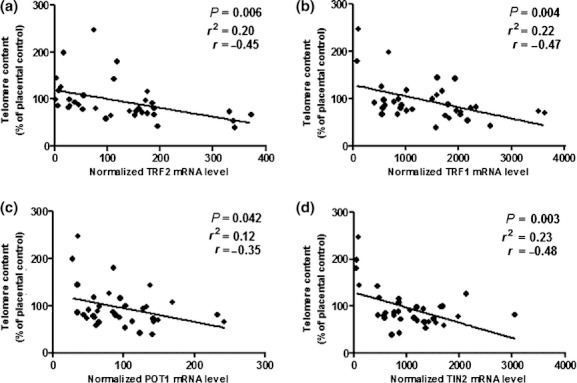
Figure 1.

Relationships between levels of mRNAs for telomere-associated proteins and telomere DNA content (TC). TC was compared with mRNA levels of TRF1, TRF2, POT1, and TIN2 assessed by quantitative RT-PCR in 36 human breast tumors. Lines on each graph were fit using simple linear regression, and statistical analysis was done to determine the significance (P-value), coefficient of determination (r2), and the correlation coefficient (r). (a) TRF2 mRNA level compared with TC, this graph shows a significant increase in TRF2 mRNA levels with decreased TC (P = 0.006). (b) TRF1 mRNA level compared with TC, this graph shows a significant increase in TRF1 mRNA levels with decreased TC (P = 0.004). (c) POT1 mRNA level compared with TC, this graph shows a significant increase in TRF1 mRNA levels with decreased TC (P = 0.042). (d) TIN2 mRNA level compared with TC, this graph shows a significant increase in TRF1 mRNA levels with decreased TC (P = 0.003).
