Figure 1.

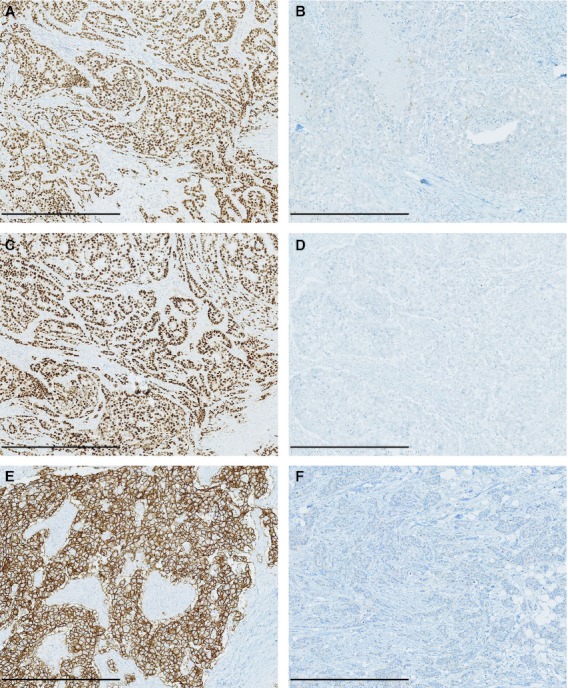
Representative images of IHC labeling of ER (A: positive; B: negative), PgR (C: positive; D: negative), and HER2 (E: positive; F: negative). Scale bars, 500 μm.

Representative images of IHC labeling of ER (A: positive; B: negative), PgR (C: positive; D: negative), and HER2 (E: positive; F: negative). Scale bars, 500 μm.