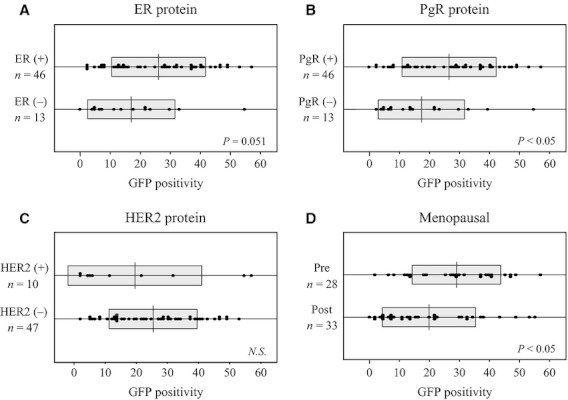
Figure 3.

Comparative analysis of GFP positivity in 62 primary breast tumor samples by clinicopathological information. These box plots show the intergroup comparison of (A) ER protein expression, (B) PgR protein expression, (C) HER2 protein expression, and (D) menopausal status.
