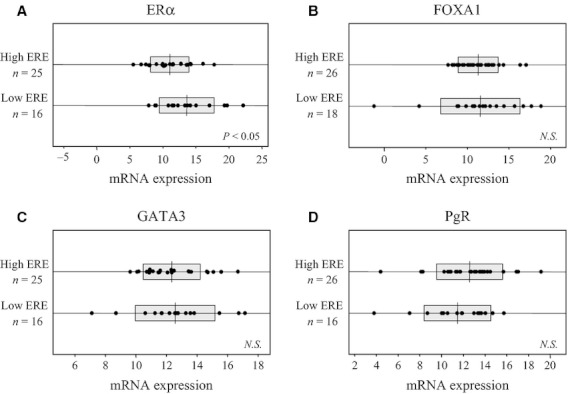
Figure 4.

The intergroup difference of ERα and its related or target gene mRNA expression in 46 ER-positive breast tumor samples divided into high- or low-ERE transcriptional activity groups. These box plots show the intergroup differences of (A) ERα; (B and C) ER-related genes: (B) FOXA1, (C) GATA3; and (D) ER target gene: PgR.
