
Fig. 1. PKCδ activation increases PC-3 prostate tumor growth.
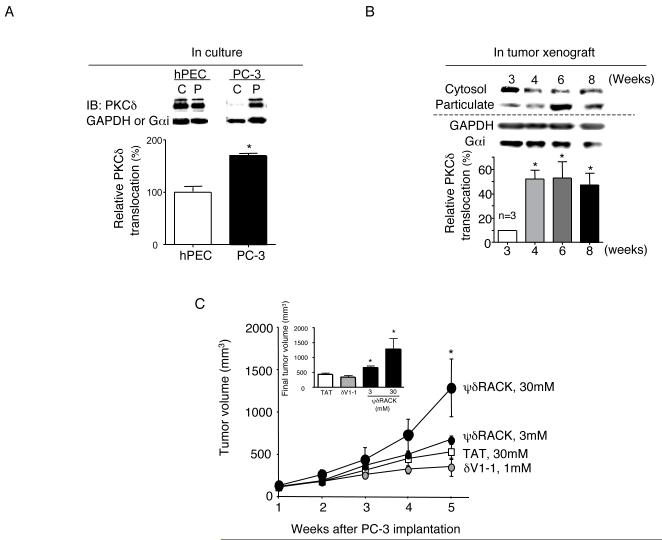
(A) The level of the active form of PKCδ was determined by Western blot analyses of cytosolic (C) and particulate (P) fractions from primary normal human prostate epithelial cells (hPEC) and PC-3 cells grown in culture. Cells were fractionated into cytosolic and particulate fractions as described in Methods. Quantification of the active forms of PKCδ (translocation; expressed as percentage of PKC isozyme in the particulate fraction over sum of cytosolic and particulate fraction enzymes, i.e., total cellular enzyme) is provided in the graph below (n=3, *; p<0.05). A 2-tailed Student’s t test was used to determine significance. Loading controls for cytosolic and particulate fractions (GAPDH and Gαi) are shown in the lower bands. IB; immunoblot. (B) PC-3 xenografts were grown s.c. on nude mice for up to 8 weeks and tumors were obtained at weeks 3-8. PKCδ translocation was analyzed using Western blot and quantification is shown on the graph below (n=3, *; p<0.05) vs. week 3. (C) One week after PC-3 cell injection, mice were implanted with osmotic pumps with control peptide (TAT) at 24 mg/kg/day (30mM) or δV1-1 conjugated to TAT at 1.4 mg/kg/day (1mM) or ψδRACK at 3.8 or 38 mg/kg/day (3mM or 30mM). The peptides were dissolved in saline and administered at a constant rate (0.5μl/hr) for 2 weeks and were replaced once for the next 2 weeks. Tumor volume was measured weekly. Tumors were excised and weighed at week 5. (White squares, TAT; small gray circles, δV1-1; small black circles, 3mM ψδRACK and large black ovals, 30mM ψδRACK, *; p<0.05, repeated ANOVA, n=5-8 each, TAT vs. 30mM ψδRACK-treated group). An inserted graph shows final tumor volumes of each treatment group.