
Fig. 1.
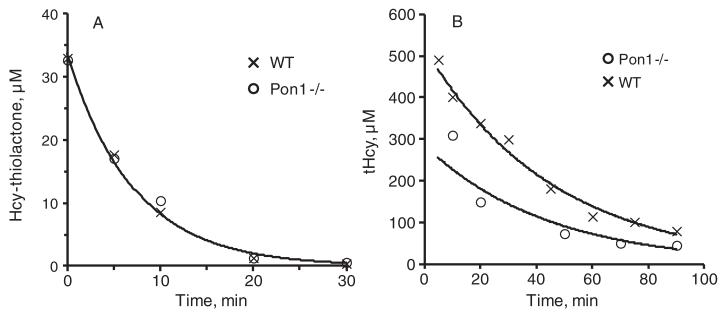
Kinetics of plasma Hcy-thiolactone and total Hcy in mice. Representative kinetics of Hcy-thiolactone (A) and tHcy (B) turnover obtained for individual Pon1−/− (○) and Pon1+/+(x) mice injected intraperitoneally with 600 nmol L-Hcy-thiolactone/g body weight are shown. Data points were fitted to the exponential equation [At] = [A0]· e−k·t, where k is a first order rate constant, [At] and [A0] are measured concentrations at time t and extrapolated concentrations at time zero, respectively.