
Fig. 1.
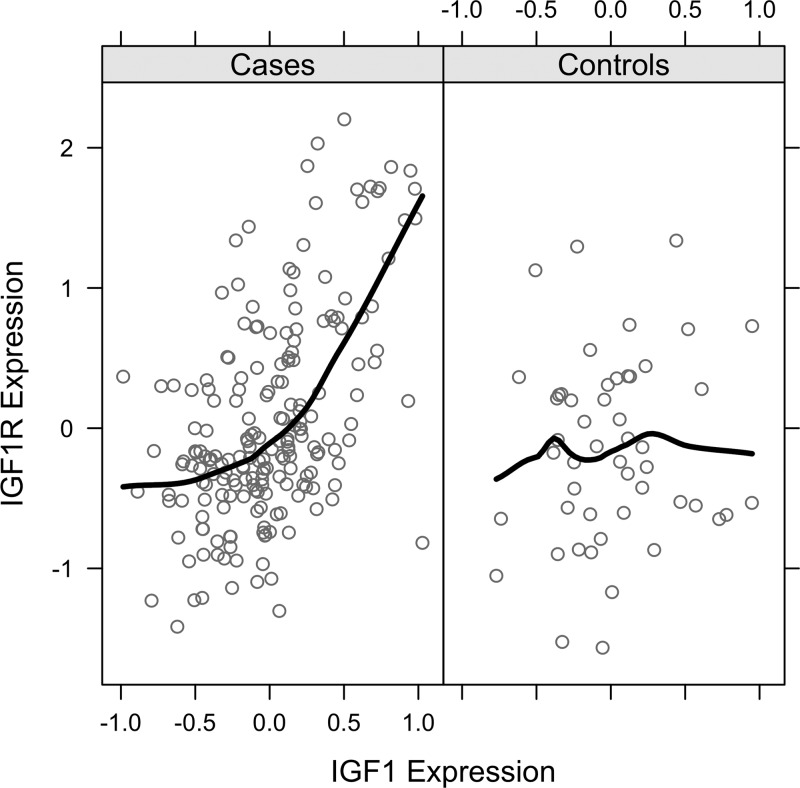
Differential gene correlation for IGF1 and IGF1R, stratified by cases and controls. Illustration of the criteria that was developed to identify genes (e.g., IGF1R) that undergo significant changes in their correlation structure with another gene (e.g., IGF1) in cases compared with controls, and whose gene-gene correlation is also significant. Each circle in the figure represents the expression level for IGF1 and IGF1R in a single sample.