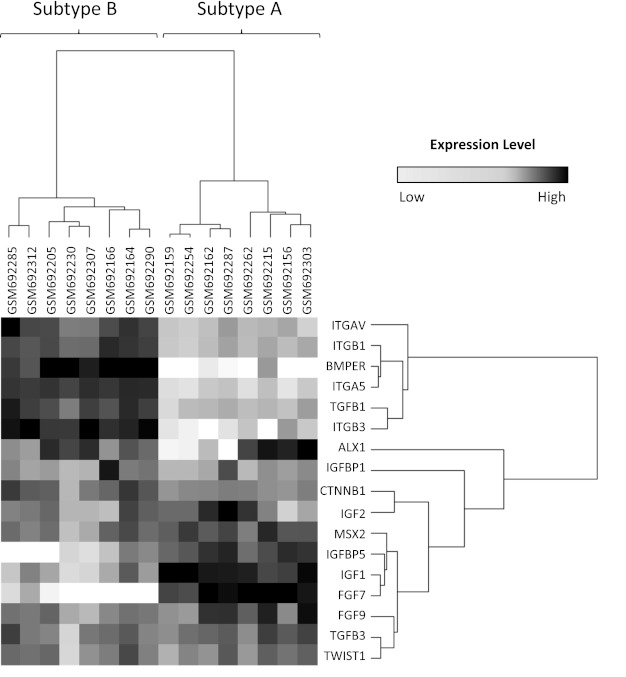
Fig. 2.

Heat map comparing gene expression levels between the 2 subtypes. Transcript levels of 17 genes previously shown to be altered by craniosynostosis were found to be differentially expressed between representative cases for subgroup A (n = 8) and subgroup B (n = 8) (P < 0.01); black represents upregulation, and white represents downregulation.
