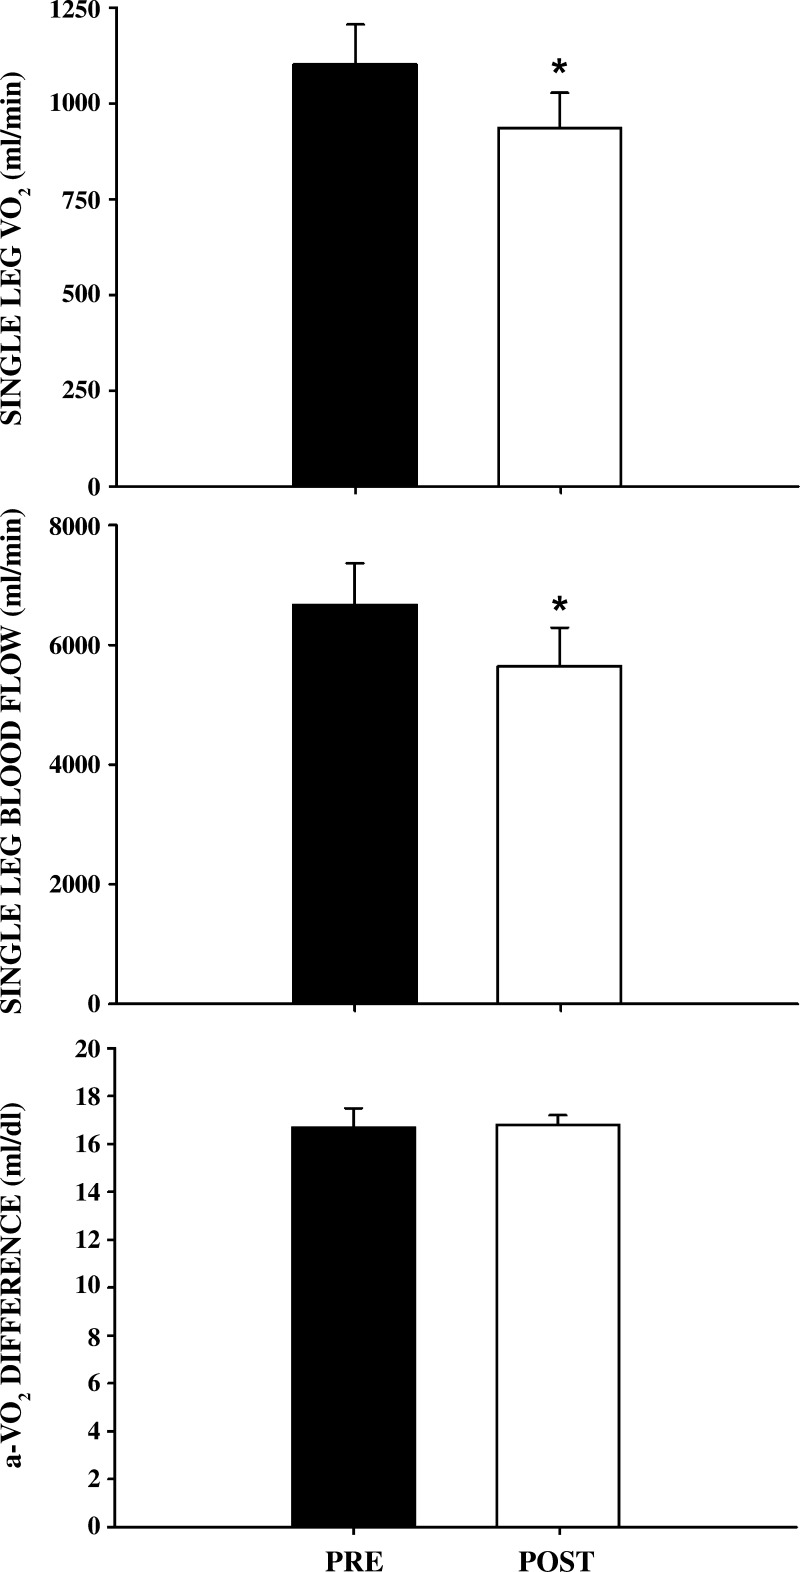
Fig. 2.
Single-leg VO2, single-leg blood flow, and arterial-venous oxygen difference before and after 8 wk of maximal strength training (MST). Single-leg V̇o2 (top panel), single-leg blood flow (middle panel), and arterial-venous oxygen difference (bottom panel) are illustrated prior to (pre) and following (post) MST. Values are means ± SE. *P < 0.05 vs. pre-MST; n = 5.

