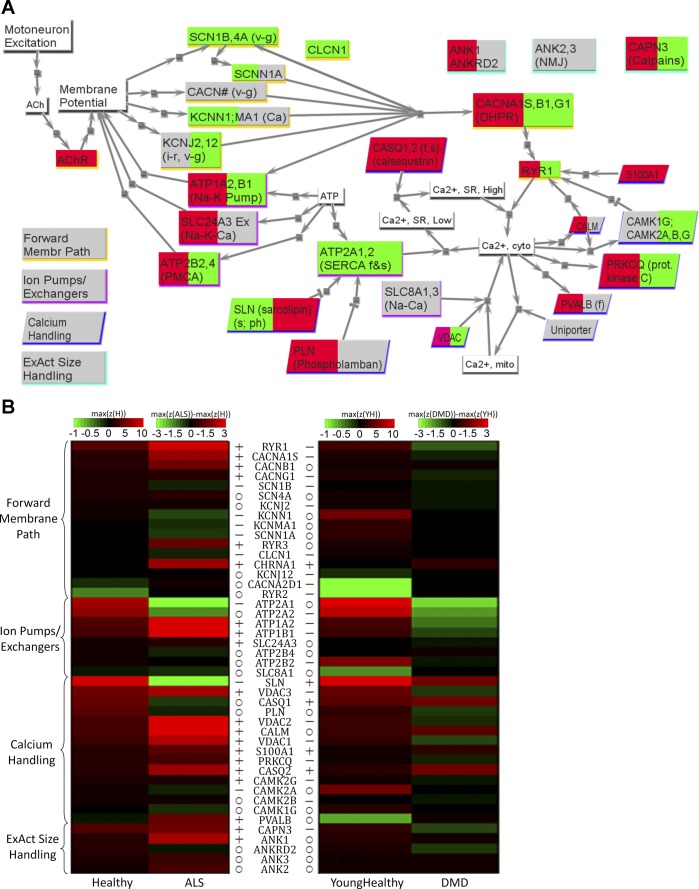
Fig. 1.
Excitation-activation (EA) family results for amyotrophic lateral sclerosis (ALS) and Duchenne muscular dystrophy (DMD). A: network view of changes for ALS (left background color) and DMD (right background color), with red implying significantly upregulated in diseased, green implying significantly downregulated in diseased, and gray implying no significant difference between diseased and healthy. Nodes with white background are signals or small molecules. Nodes with shadows are proteins, with the shadow color indicating to which one of the four subfamilies listed on the bottom left the protein belongs. For description of subfamilies, please see the companion paper (81a). B: heat map comparing the transcriptome data for healthy skeletal muscle to those of ALS and DMD. For each group, assuming there are N microarrays in the group, and in one microarray there are M probes targeting the same gene, then the corresponding z-score in this heat map is maxi=1 … M(1/N ∑j=1NZij). For healthy and young healthy, the color corresponds to the absolute z-score values. For ALS and DMD, the color corresponds to the difference (i.e., ALS − healthy, DMD − young healthy). If the difference is higher than 3 (or lower than −3), the color corresponding to 3 (or −3) is used. Genes are grouped based on subfamilies. For each subfamily, genes are sequenced according to the maximum mean z-scores in healthy. Left column: healthy and ALS. Right column: young healthy and DMD. The symbols before (for ALS and healthy) and after (for DMD and young healthy) the gene names indicate the results of t-test between healthy and diseased (P < 0.05). o, No significant difference; +, significantly higher in diseased than in healthy; −, significantly lower in diseased than in healthy. See text and supplemental tables for definitions of acronyms.

