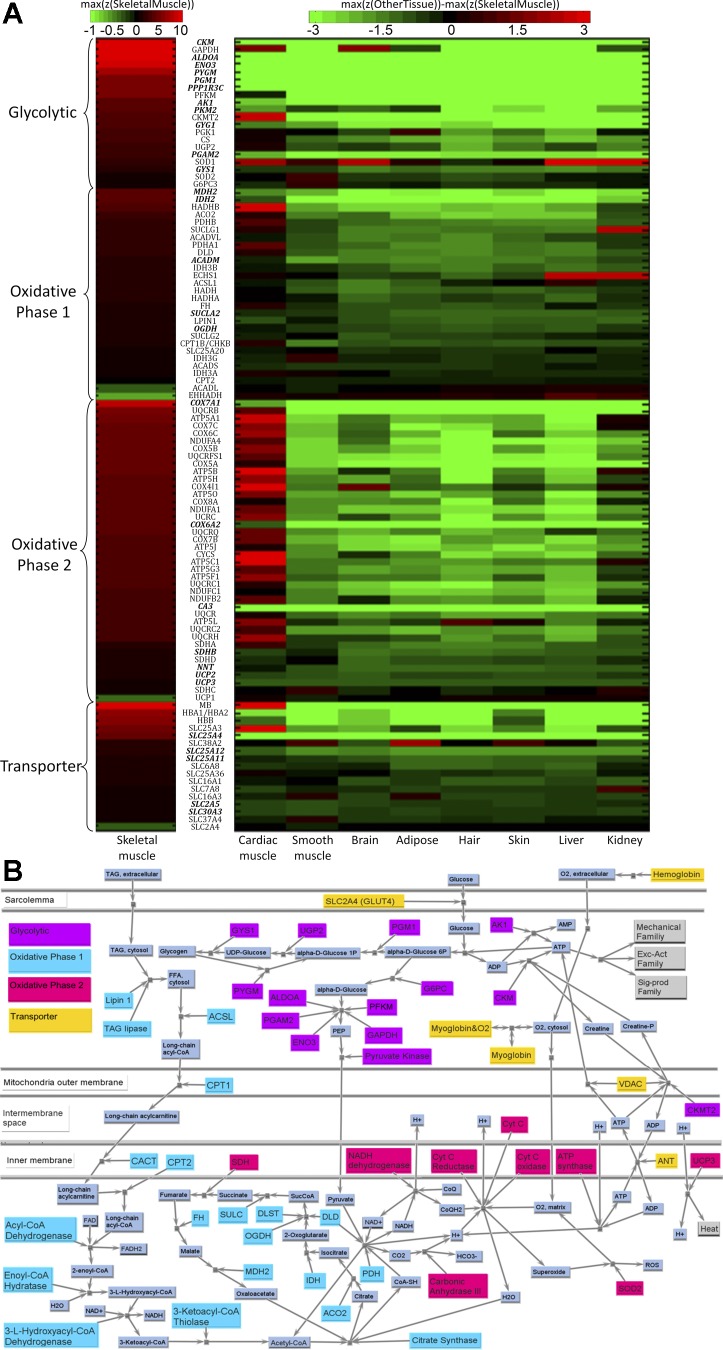
Fig. 7.
A: key transcripts in METB family. Transcripts with bold and italic font have higher z-scores in skeletal muscle than in other tissues (P < 0.05). See Fig. 5A legend for description of color-coded scheme. B: the protein network of METB model family. This model is partitioned into four subfamilies: oxidative, including members helping transfer lipid into mitochondria, enzymes involved in β-oxidation and TCA cycle; glycolytic, including members involved in supporting immediate energy, glycolysis, and glycogenesis; electron transport, including members generating the mitochondrial membrane potential and producing ATP; and transport, involved in transporting materials such as glucose and oxygen. See text and supplemental tables for definitions of acronyms. See text and supplemental tables for definitions of acronyms.

