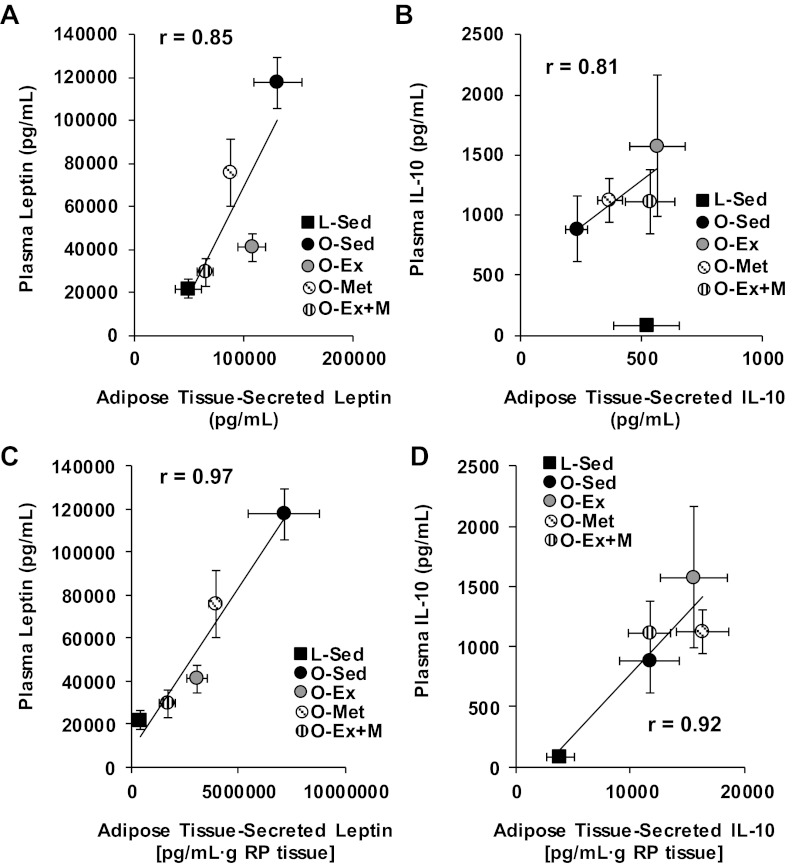
Fig. 4.
Correlations between (A) leptin concentrations in RP adipose tissue-conditioned buffers and plasma leptin concentrations; (B) IL-10 concentrations in RP adipose tissue-conditioned buffers and plasma IL-10 concentrations; (C) the product of leptin secretion × RP mass and plasma leptin concentrations; and (D) the product of IL-10 secretion × RP mass and plasma IL-10 concentrations. Note that the relationship shown for IL-10 (B) is among OLETF groups only.

